













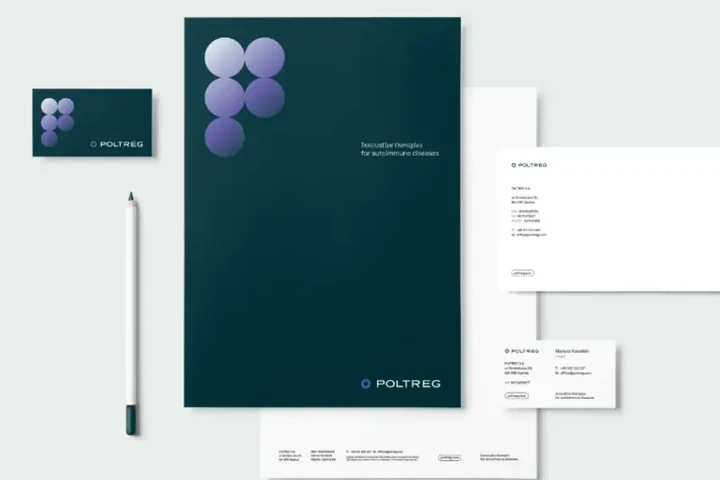

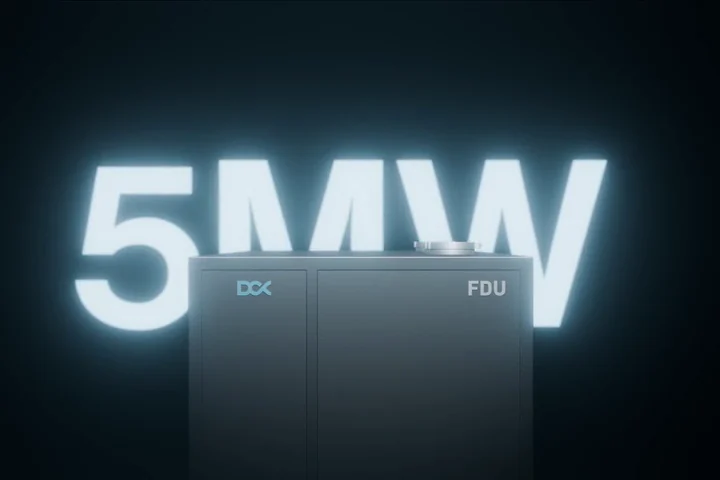
Presentation design.
One idea per slide. Numbers straight from the spreadsheet.
We design presentations that win clients, sum up the year, announce new strategies and motivate teams. Some play on LED walls, but most do their work across a table and by email. Charts are linked to spreadsheets, so finance can correct the numbers even on the morning of the board meeting, and the layout won't fall apart.
Showreel with sound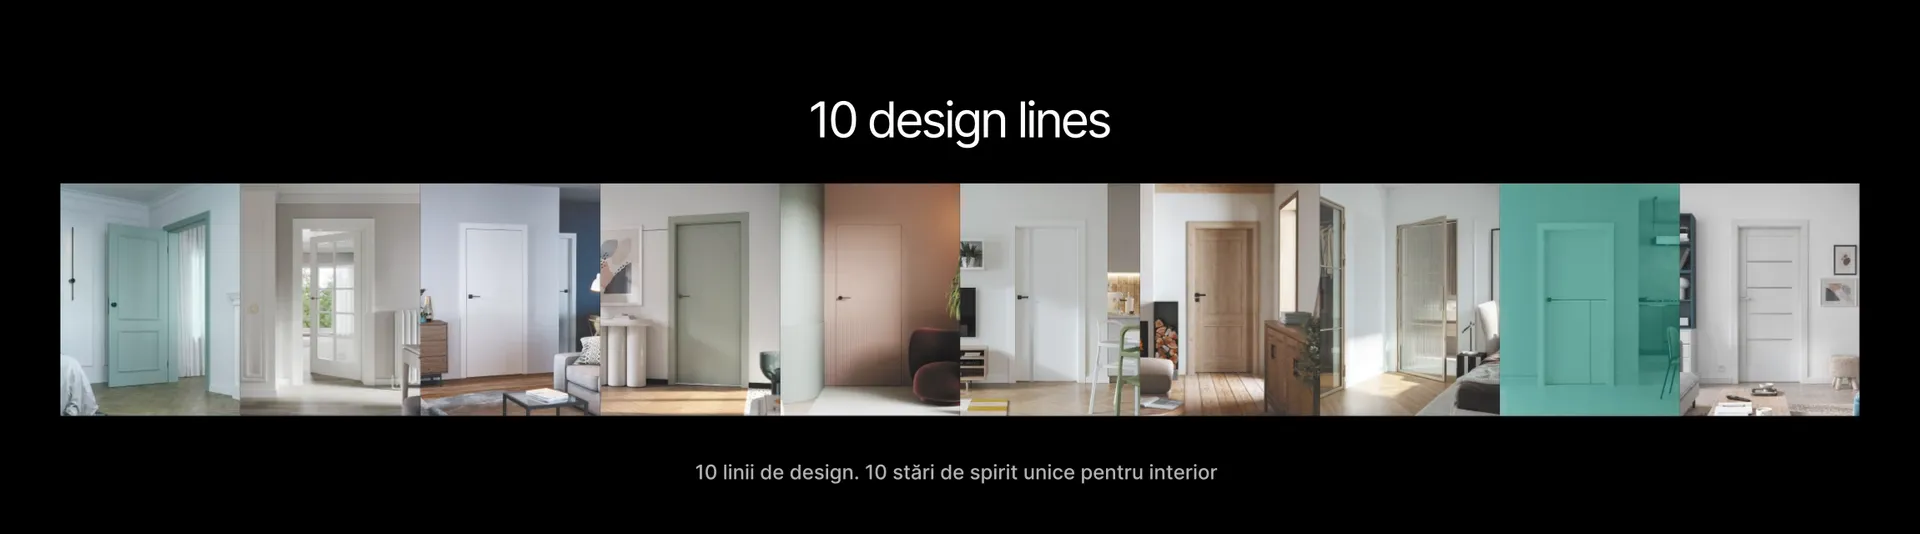
01Approach
What makes a presentation look good and work hard?
This is how we work on every presentation, from a proposal for a single meeting to a deck the whole company uses: storyline first, slides second. At every stage you know what we're doing, why and when.
-
Storyline
We start with what the audience should remember, whether it's the board, a client or the team. From an outline, notes or an old presentation we build a plan: what is said, in what order, and which slide carries it. That's storytelling without the waffle.
-
One idea
When a slide tries to say three things, we split it into three. The presentation gains a rhythm, and the audience gets room to breathe.
-
Data
Numbers become a chart, a diagram or an infographic. Charts are linked to the spreadsheet they come from, so finance corrects the data in Excel and the slide updates without losing its layout. The title states the conclusion; the full table waits in the appendix.
-
Images
We choose photos, renders and illustrations that actually show something. A stock handshake has yet to convince a single board.
-
Motion
We animate where motion helps follow the thread: a chart grows, a diagram builds step by step, and on an LED wall whole slides play like a film. Fireworks we save for New Year's Eve.
-
Template
Finally, the team gets a template with slide masters and a short guide. The logo, grid and colours are locked, so the team can put the next presentation together on its own, in software it knows.
02What we design
What kind of presentation do you need?
These are the ones we design most often. For each: what we do, what you get, and a project you can look at.
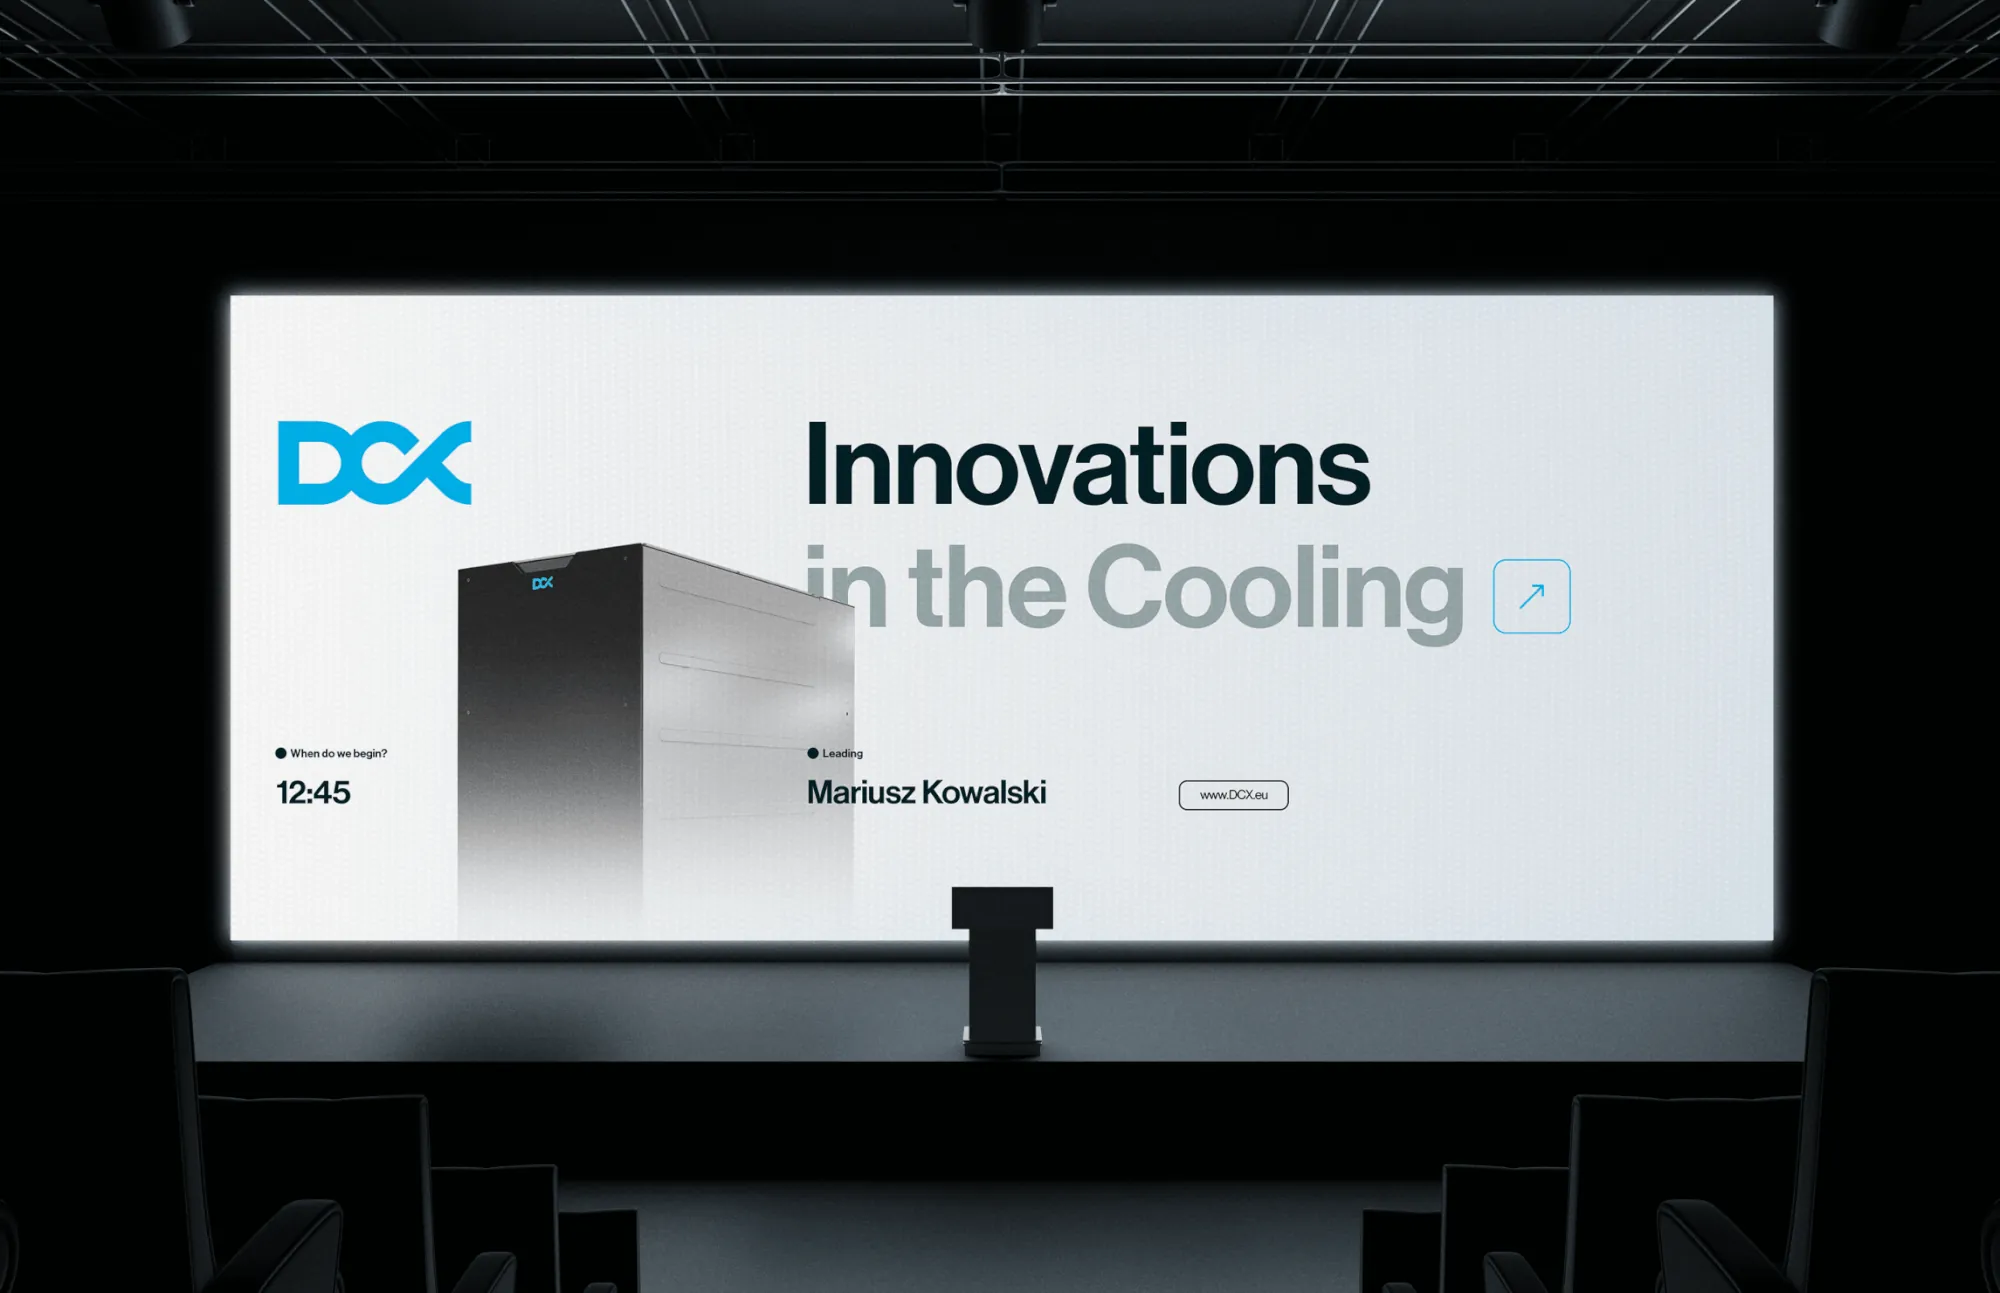
For the stage and conferences Talks at conferences, galas and webinars
What we do
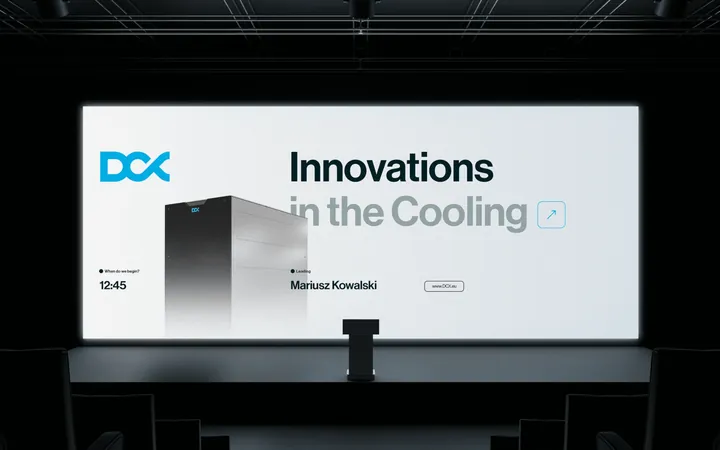
Big type, little text, images readable from the back row. We design to the screen's proportions, LED walls included, and embed videos in the file so nothing depends on the venue's internet.
What you get
- A presentation for the talk
- A version for LED screens and unusual formats
- Animations and videos embedded in the file
- A backup PDF version
Similar projects
Sales and proposals For client meetings and for sending after the call
What we do
The presentation a sales rep takes to a client. We build it from blocks: company, offer, case studies, figures and contact. It's easy to shorten, translate and assemble for a specific conversation.
What you get
- A company presentation in a long and a short version
- A slide library for building new versions
- Language versions in the same layout
- A PDF to send after the meeting
Similar projects
Investors and results Quarterly results, annual report, pitch deck for funds
What we do
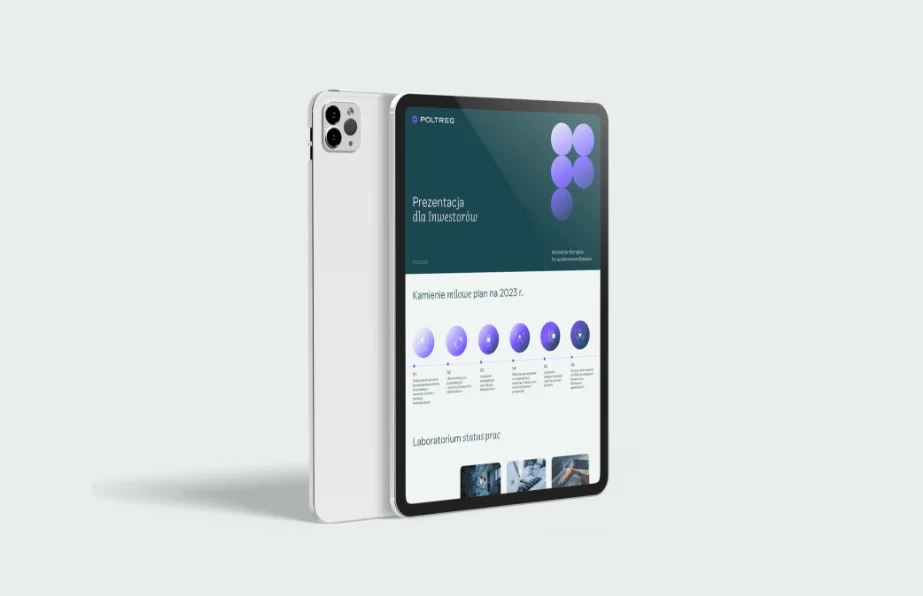
In an investor presentation the numbers match the report to the decimal point, and the charts say the same as the tables, because both take their data from the same spreadsheet. We save the creativity for the cover. The design follows the company's identity and comes with a template for the quarters ahead.
What you get
- A pitch deck or a results presentation
- Charts consistent with the report
- A template for the quarters ahead
- A PDF version for sending
Similar projects
Company and products Presenting the company, a new product or an offer for partners
What we do
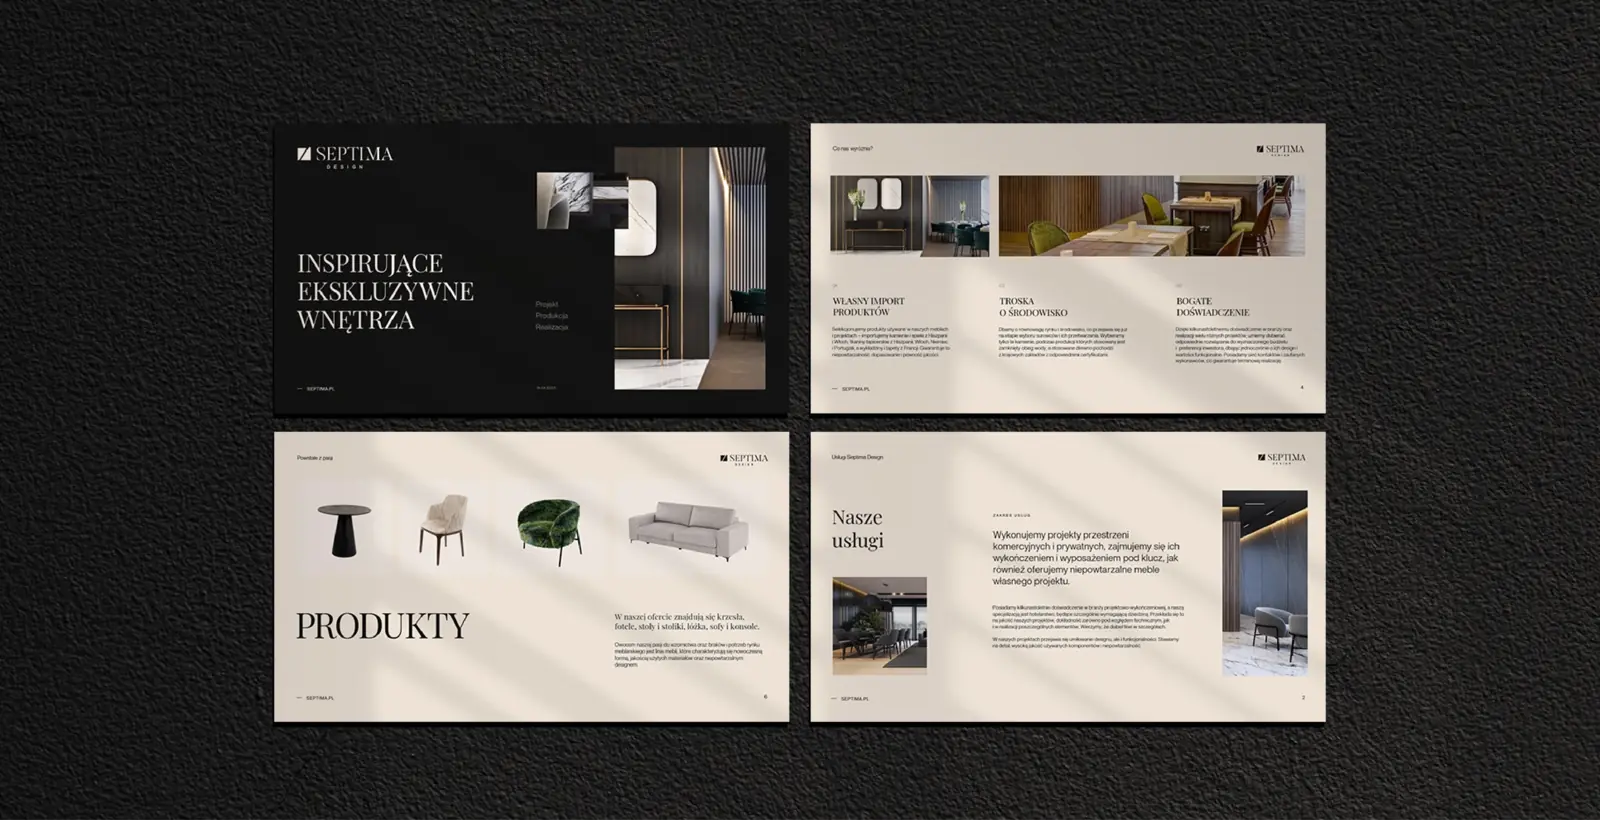
We work out what should stick after five minutes, and choose images to match: projects, products, people at work. A presentation like this works in meetings, at trade fairs and in an email to a partner.
What you get
- A presentation about the company or a product
- Photos, renders and icons in one style
- A version for screen and for print
- A template for updates
Similar projects
Internal and strategy Year-end reviews, new strategies, team meetings and training
What we do
A strategy meant to win the team over won't fit into a bullet list. We sort out the storyline, turn numbers into images and processes into simple diagrams. A presentation like this works at an all-company meeting, and later on the intranet when someone wants to go back to it.
What you get
- A presentation for a team or board meeting
- Step-by-step diagrams of goals and processes
- A PDF version to read on your own
- A template for future reviews
Templates and slide masters For teams that make presentations every week
What we do
A template in the software your team works in: slide masters, colours, typefaces, icons and charts set up so that every new slide looks like the brand straight away. Plus a short guide to what goes where.
What you get
- Slide masters
- A library of icons, charts and photos
- A guide for the team
- A version in PowerPoint, Google Slides, Canva or Figma
Similar projects
03Before and after
Same content, a better performance.
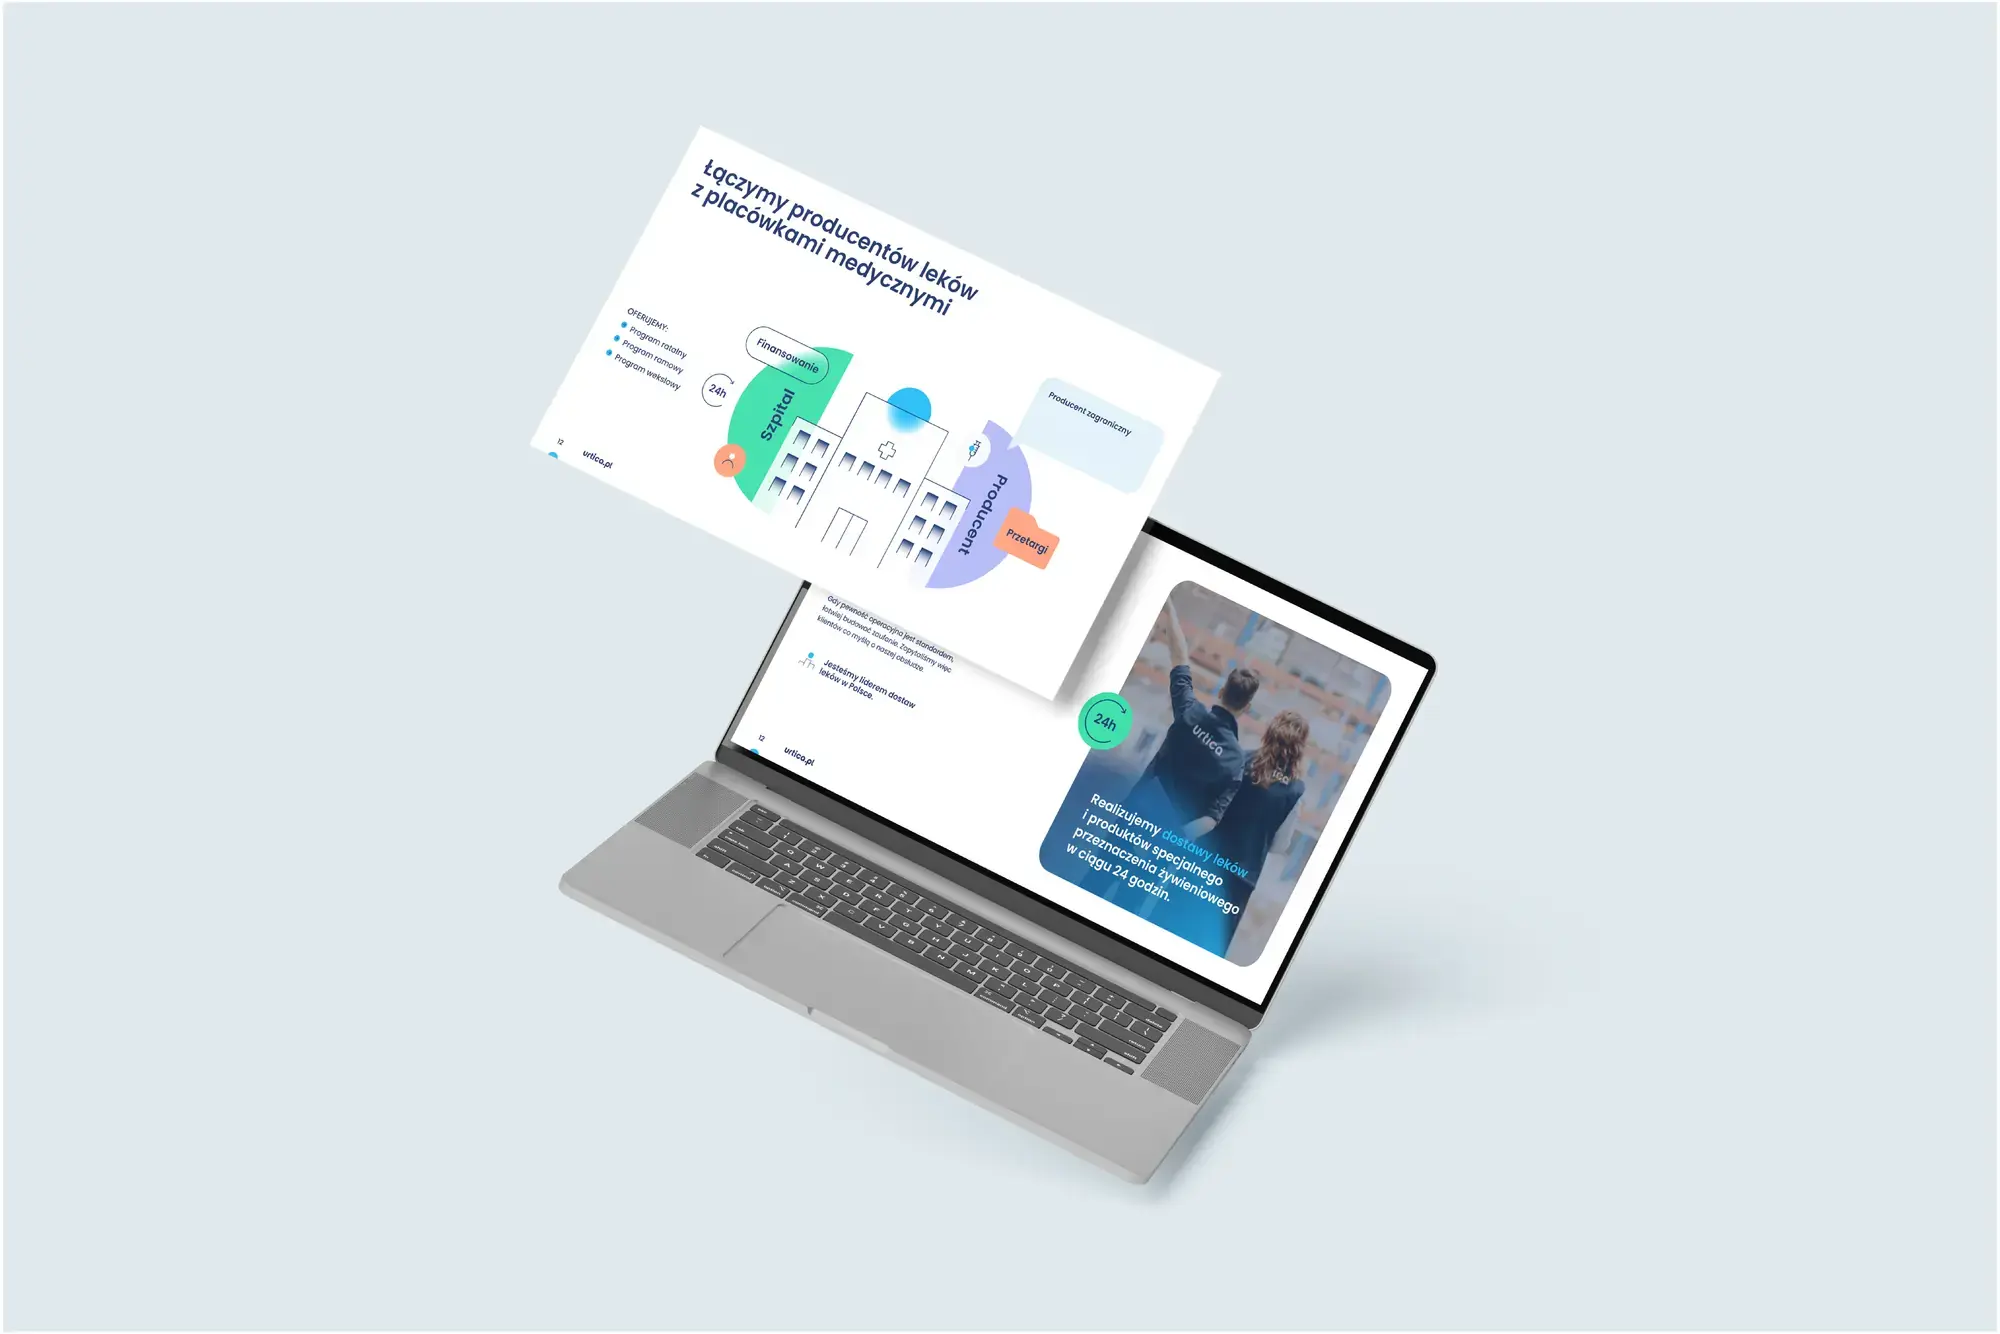
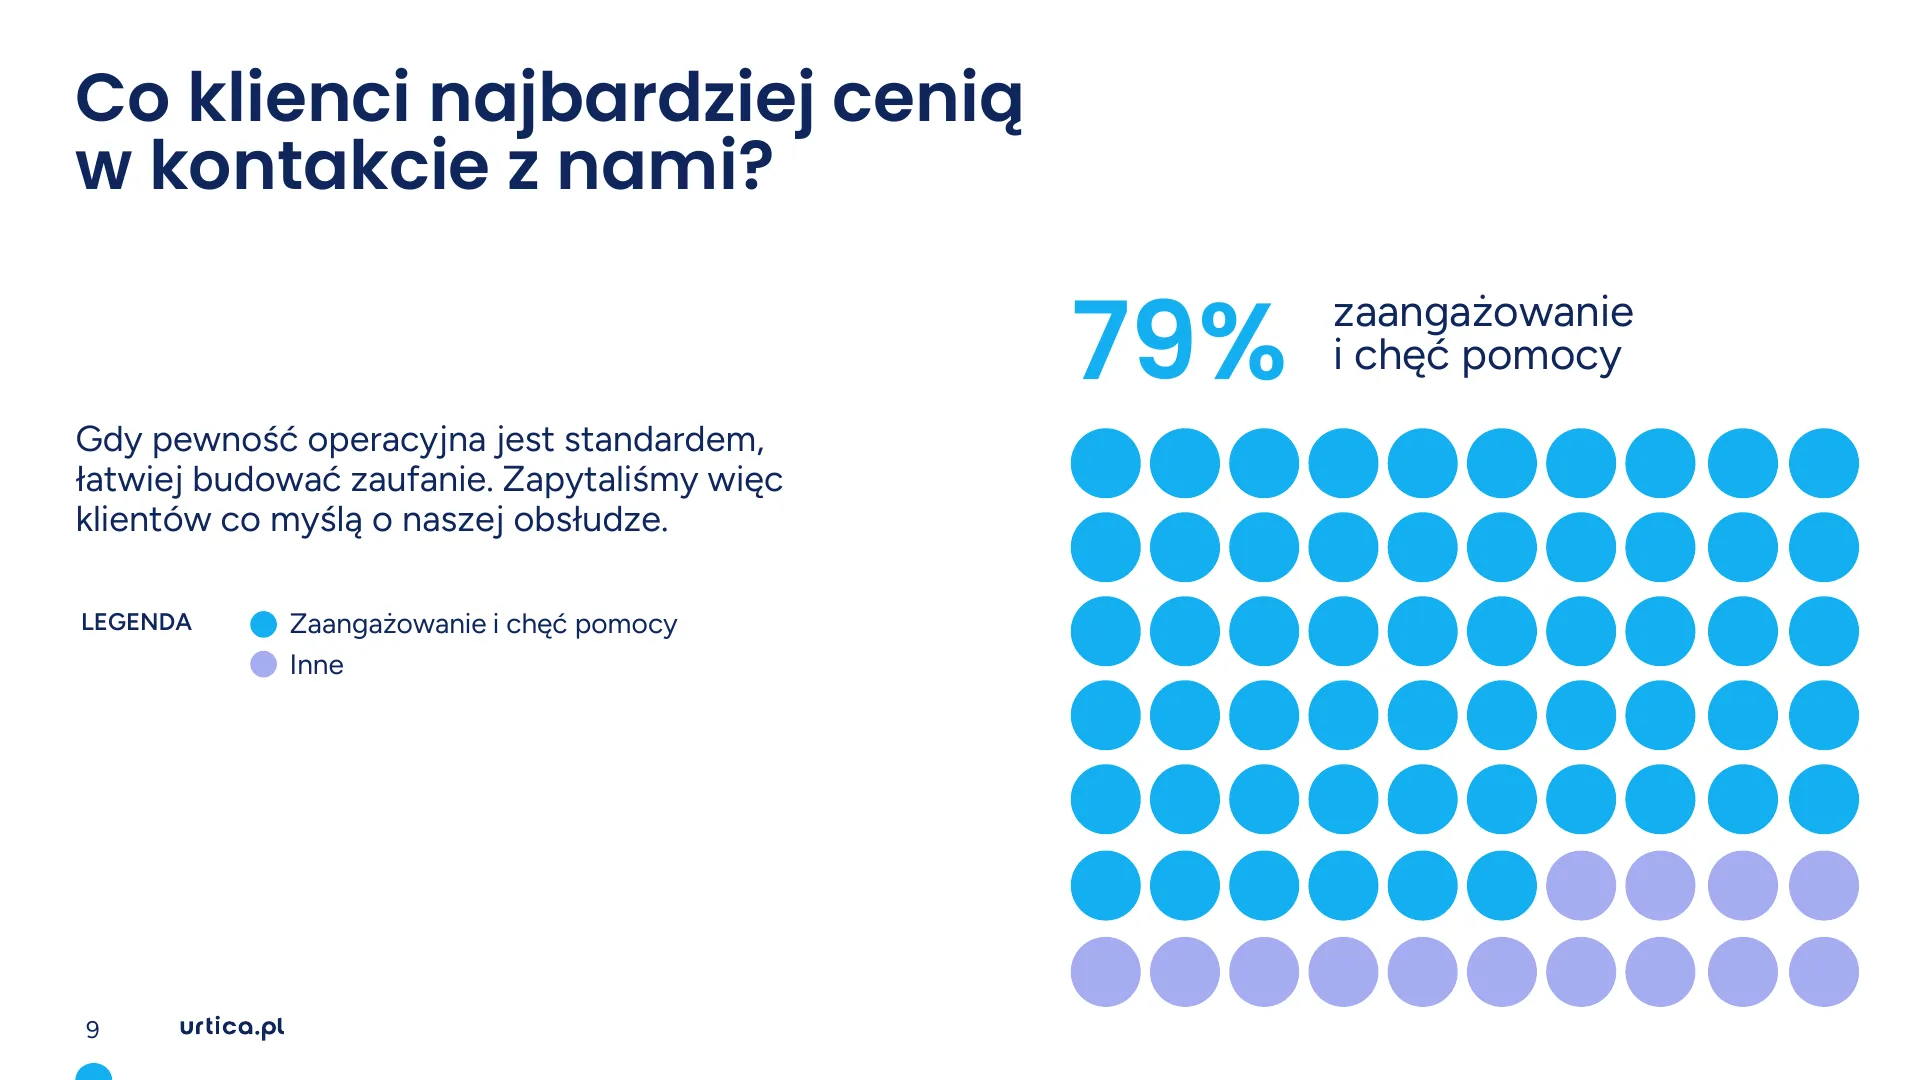
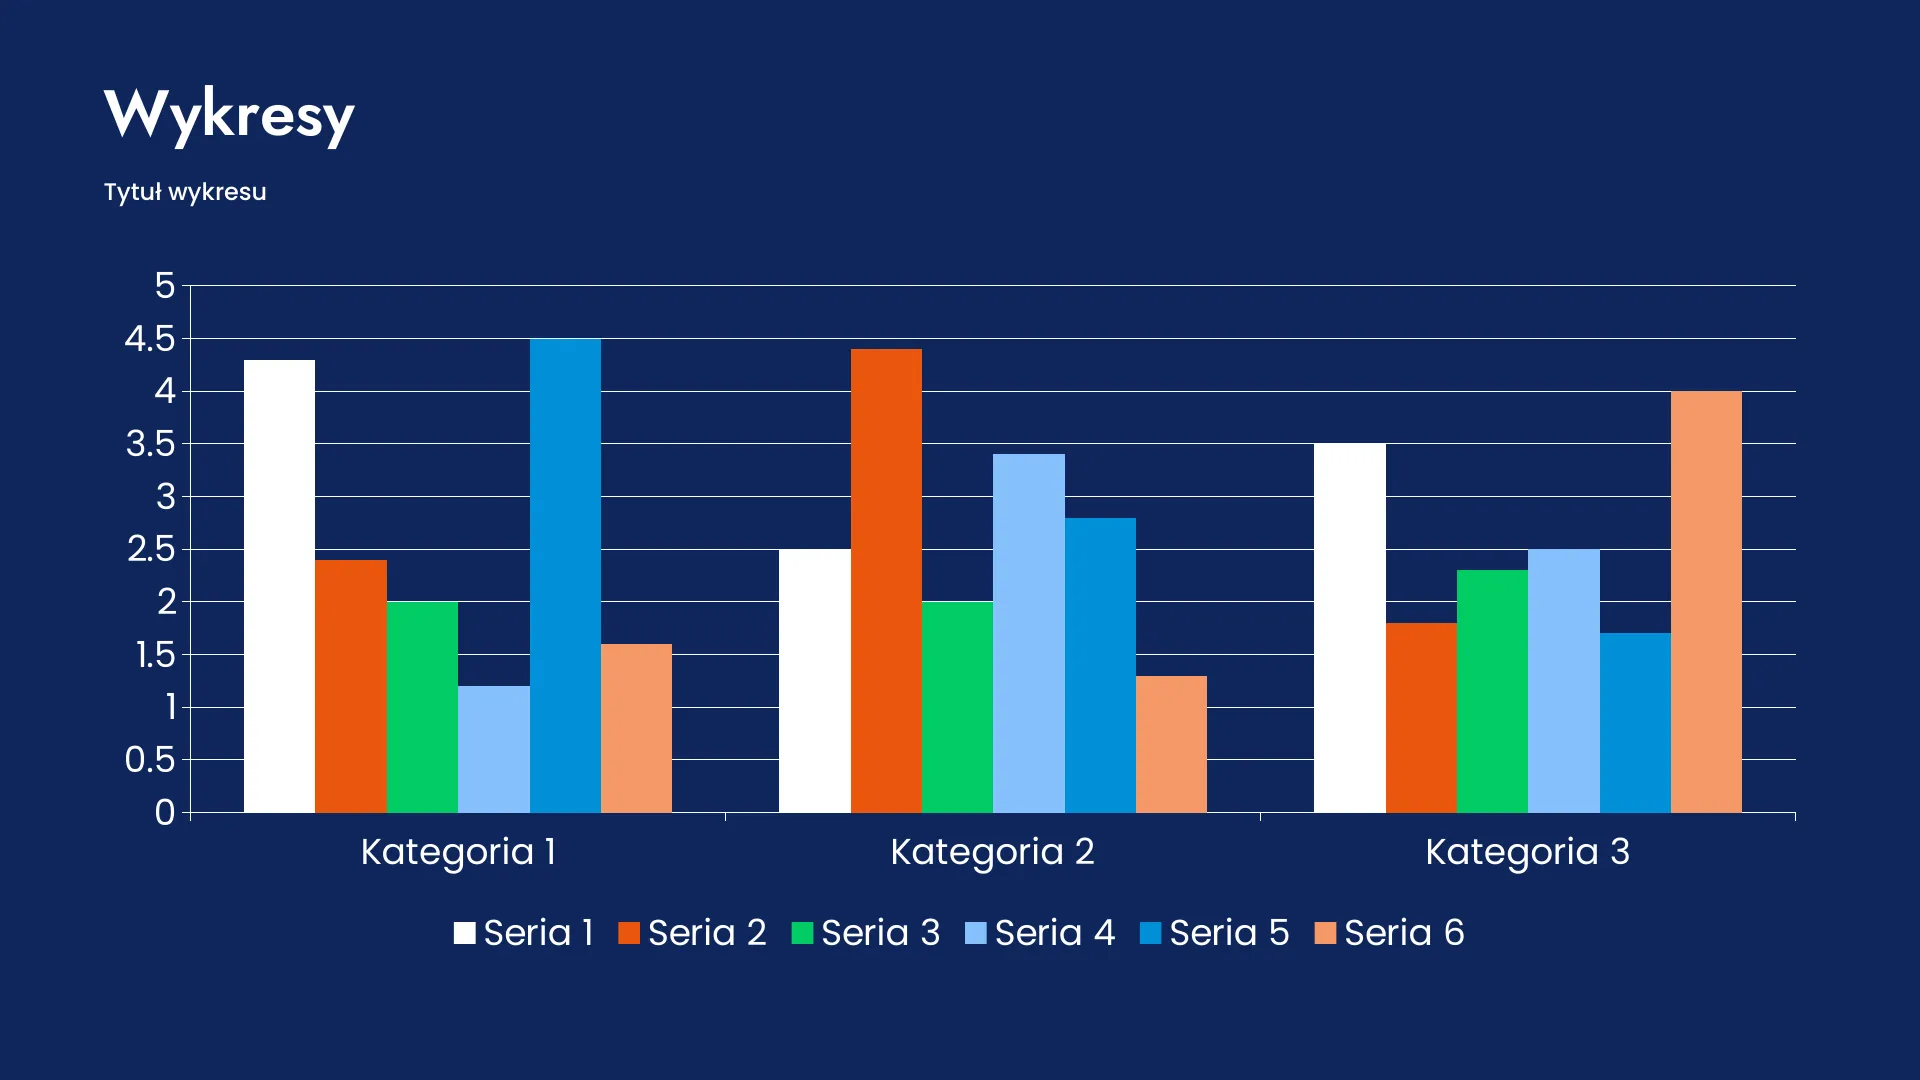
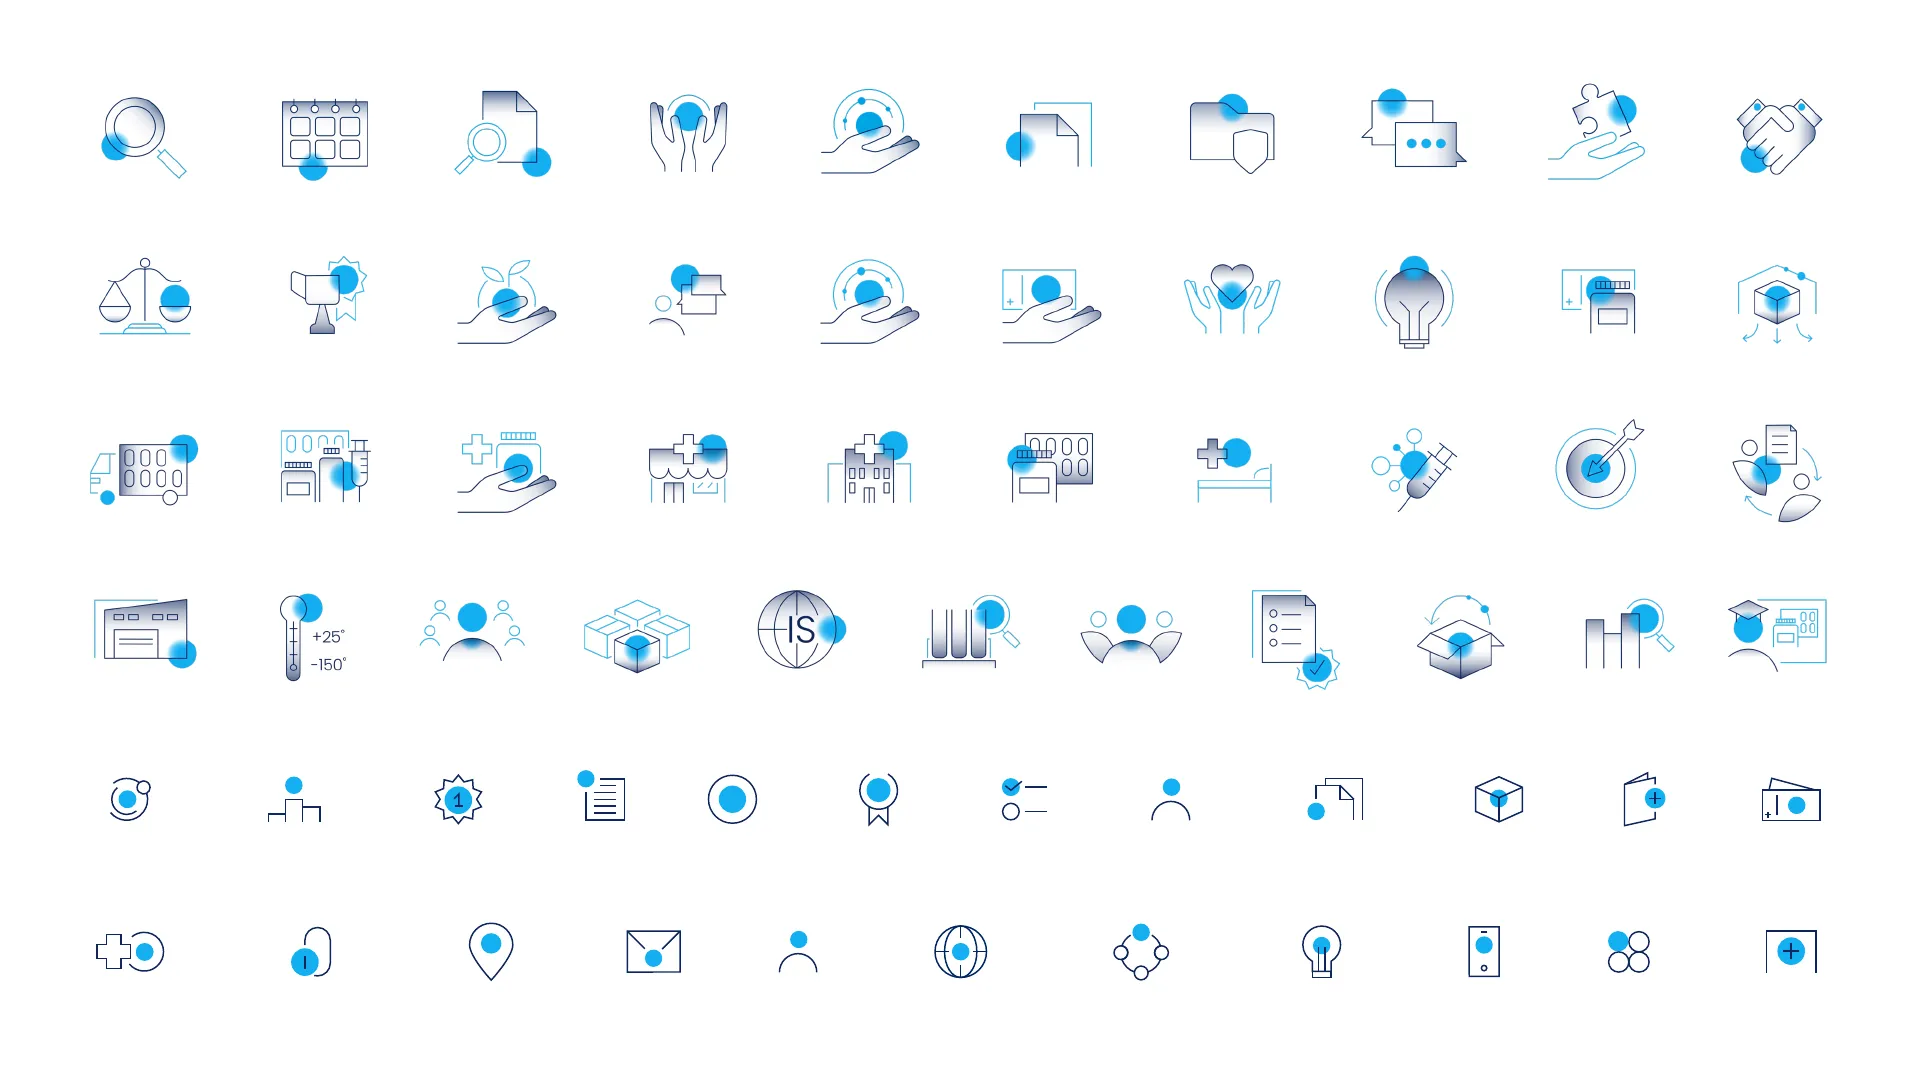
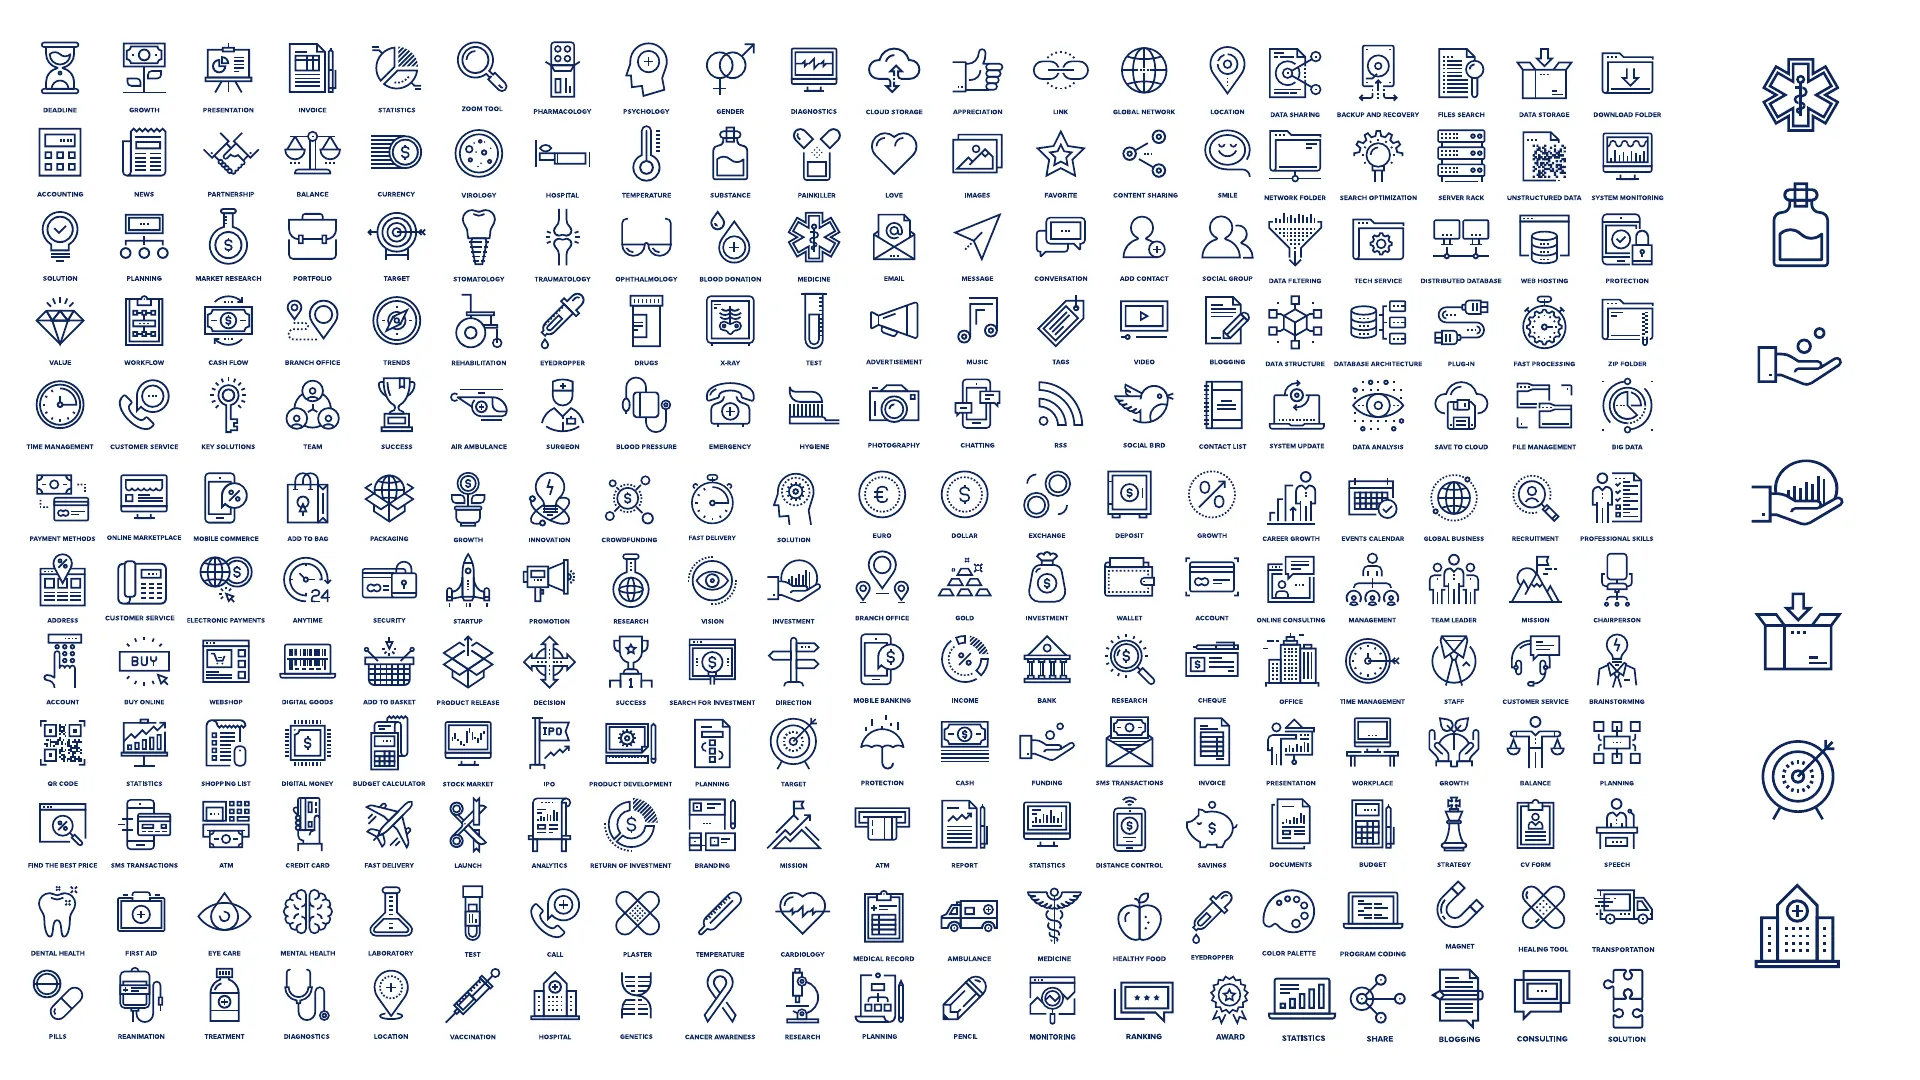
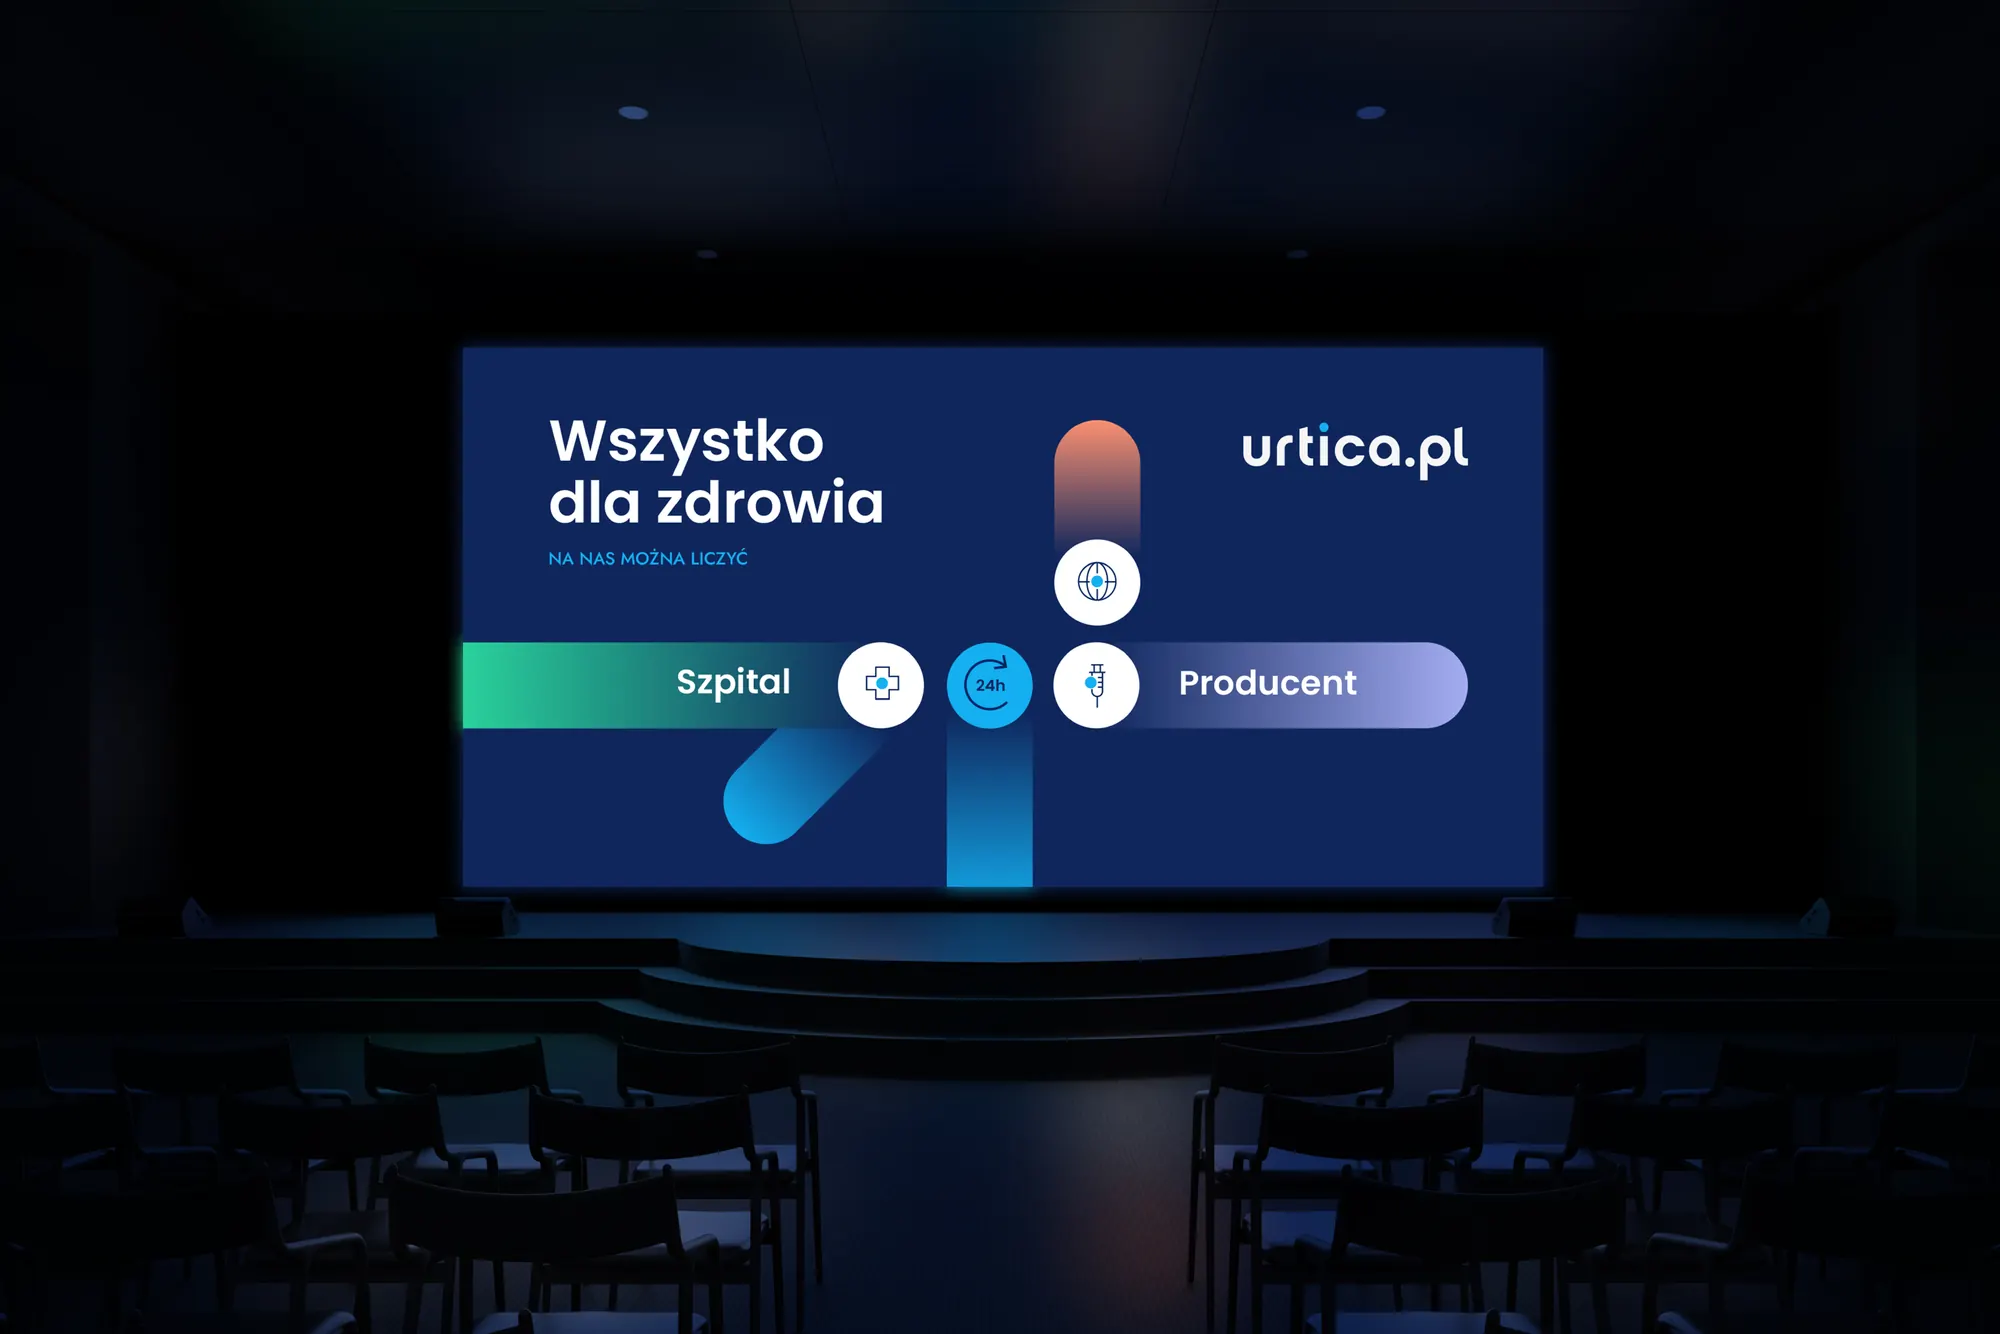
Urtica, Poland's largest distributor of medicines to hospitals, came to us with an old template: a navy background, thin arcs and a pack of several hundred stock icons. We built the new template on the rules of the new identity. The content of the slides stayed the same.
 New template
 Old template
 New template
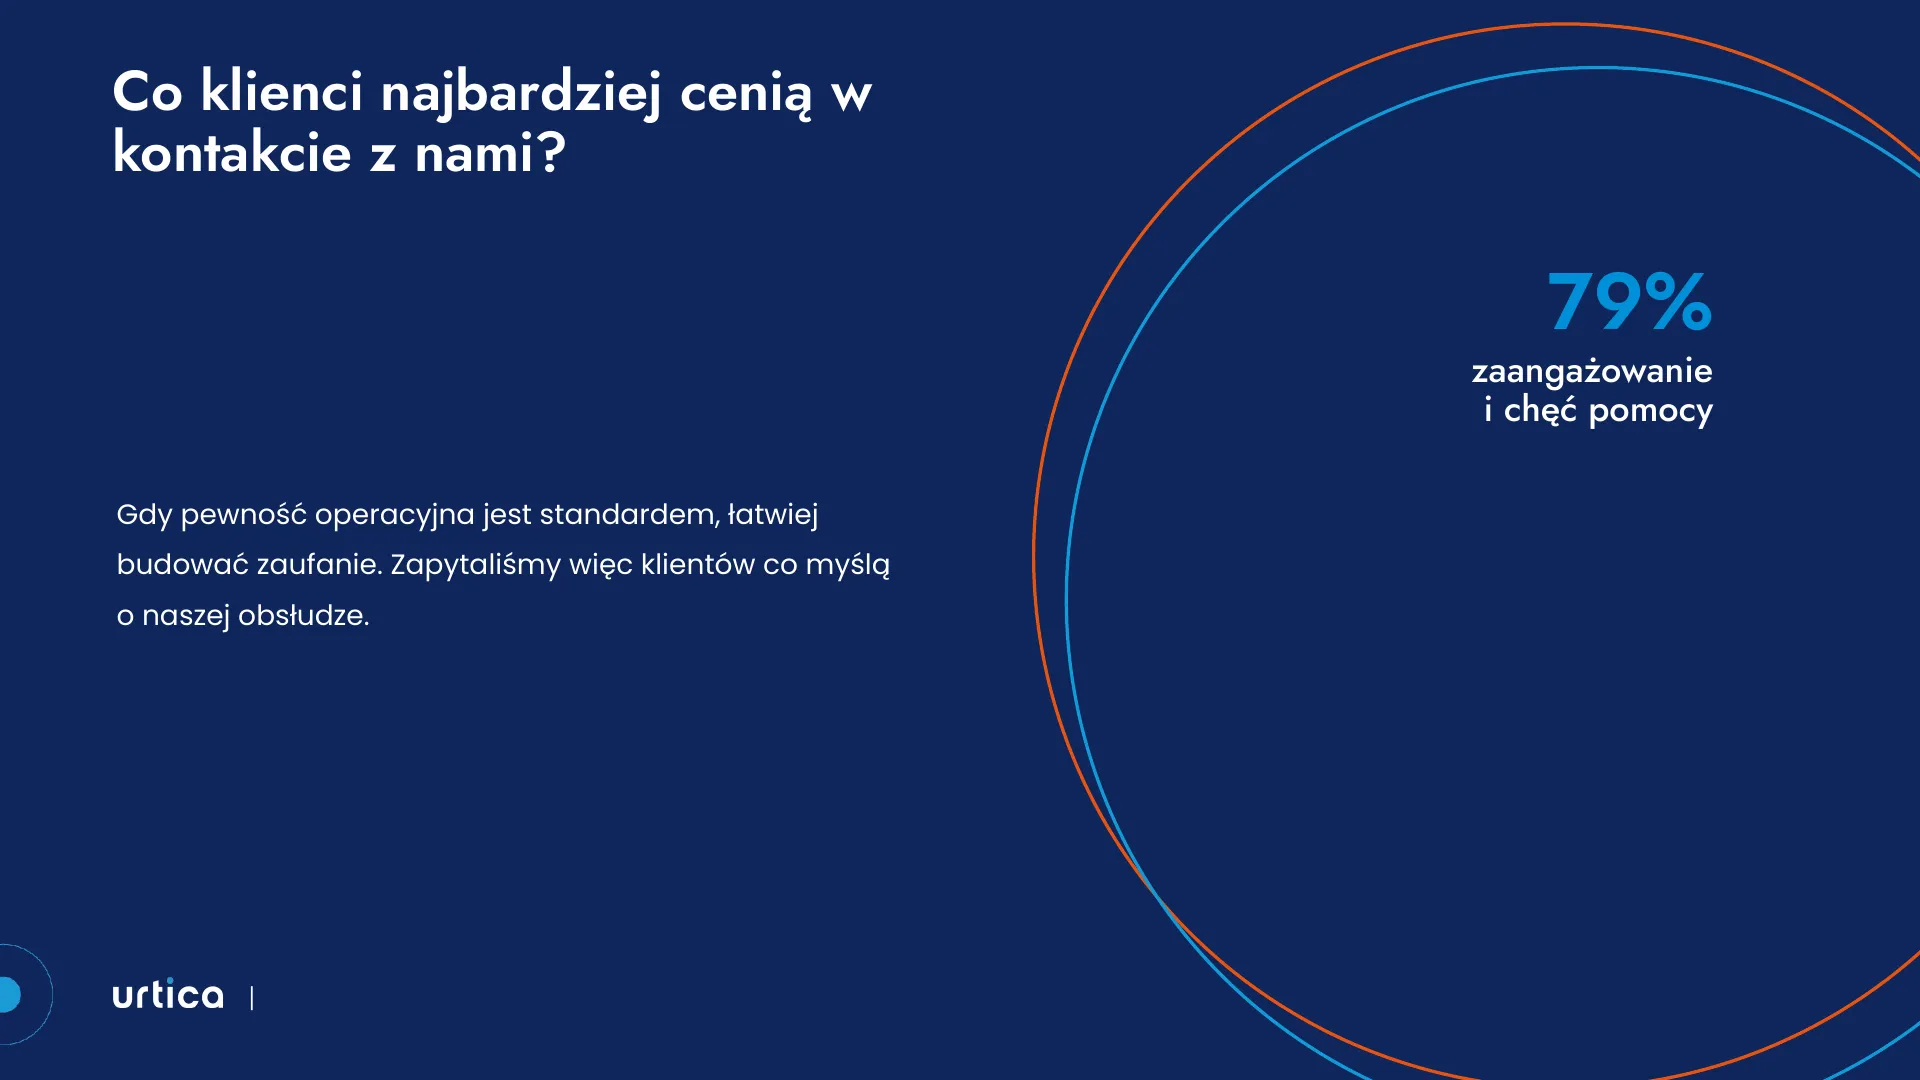 Old template
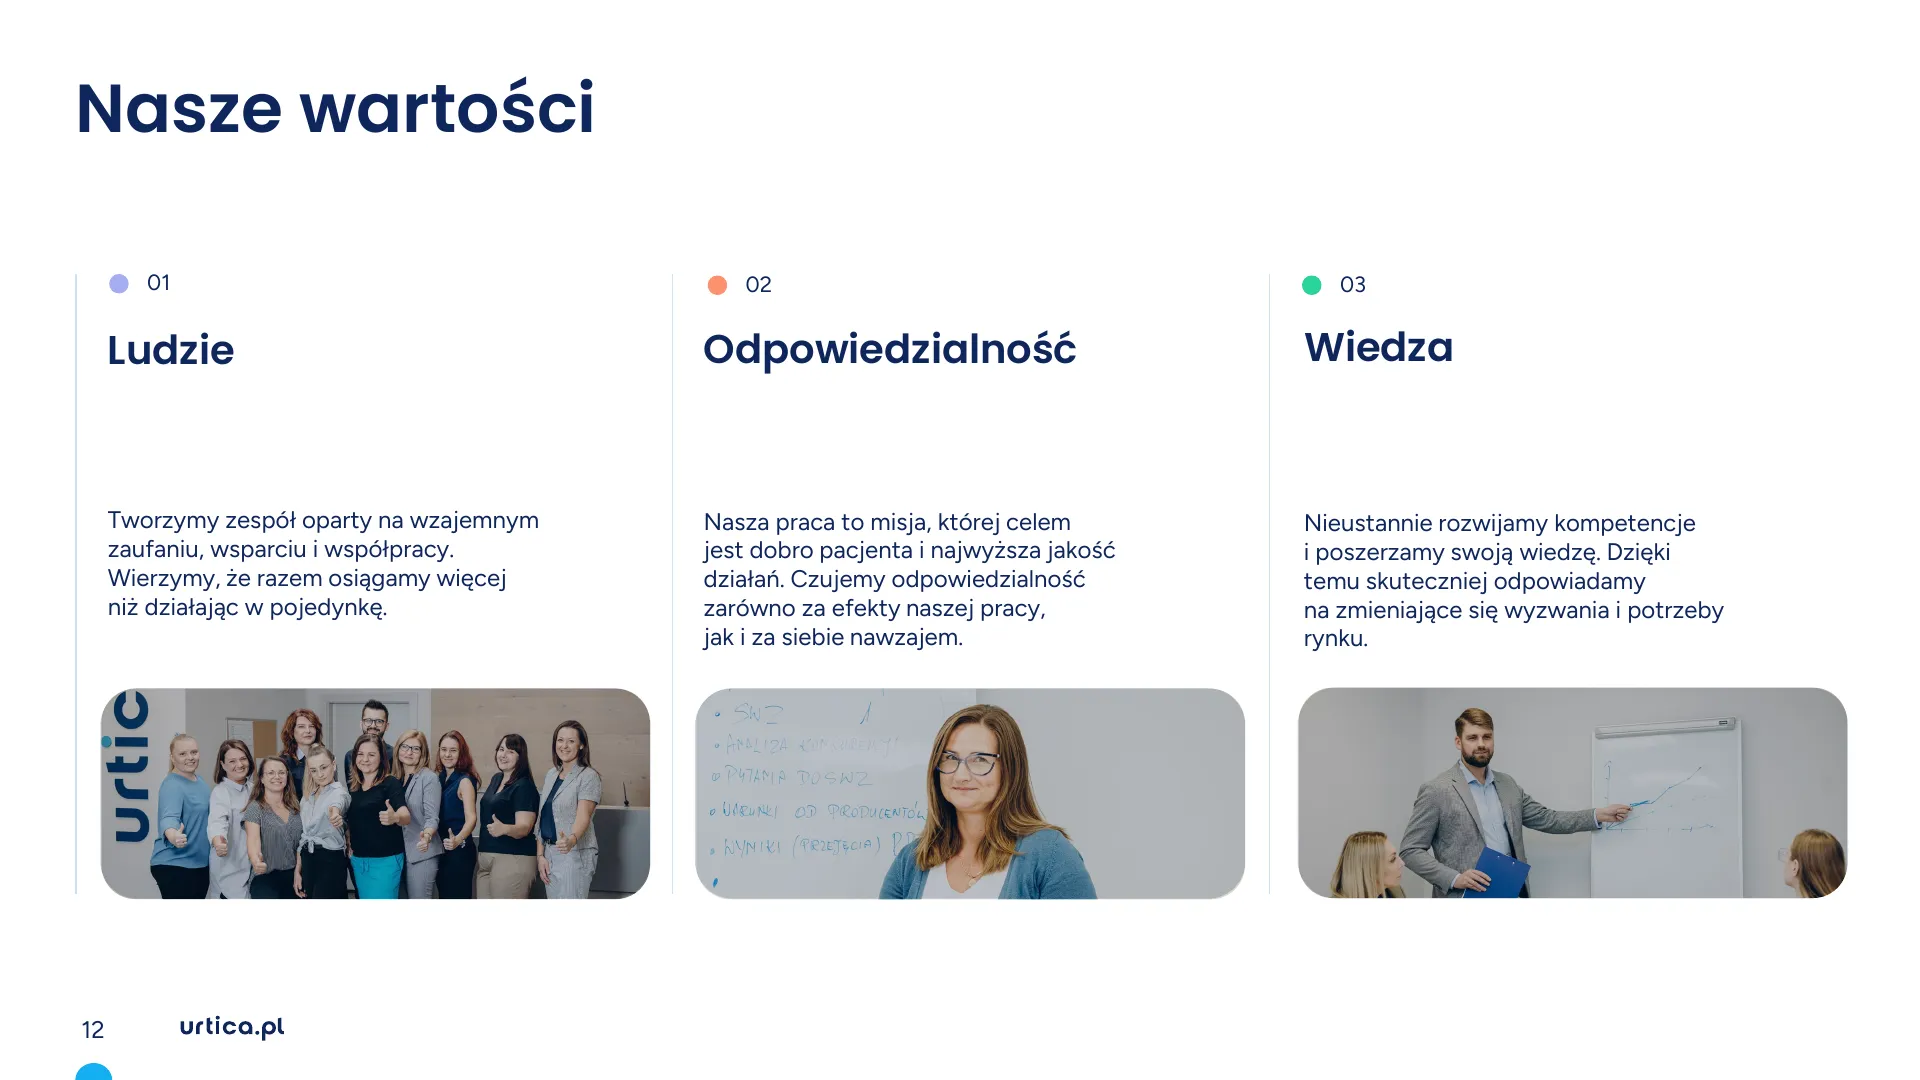 New template
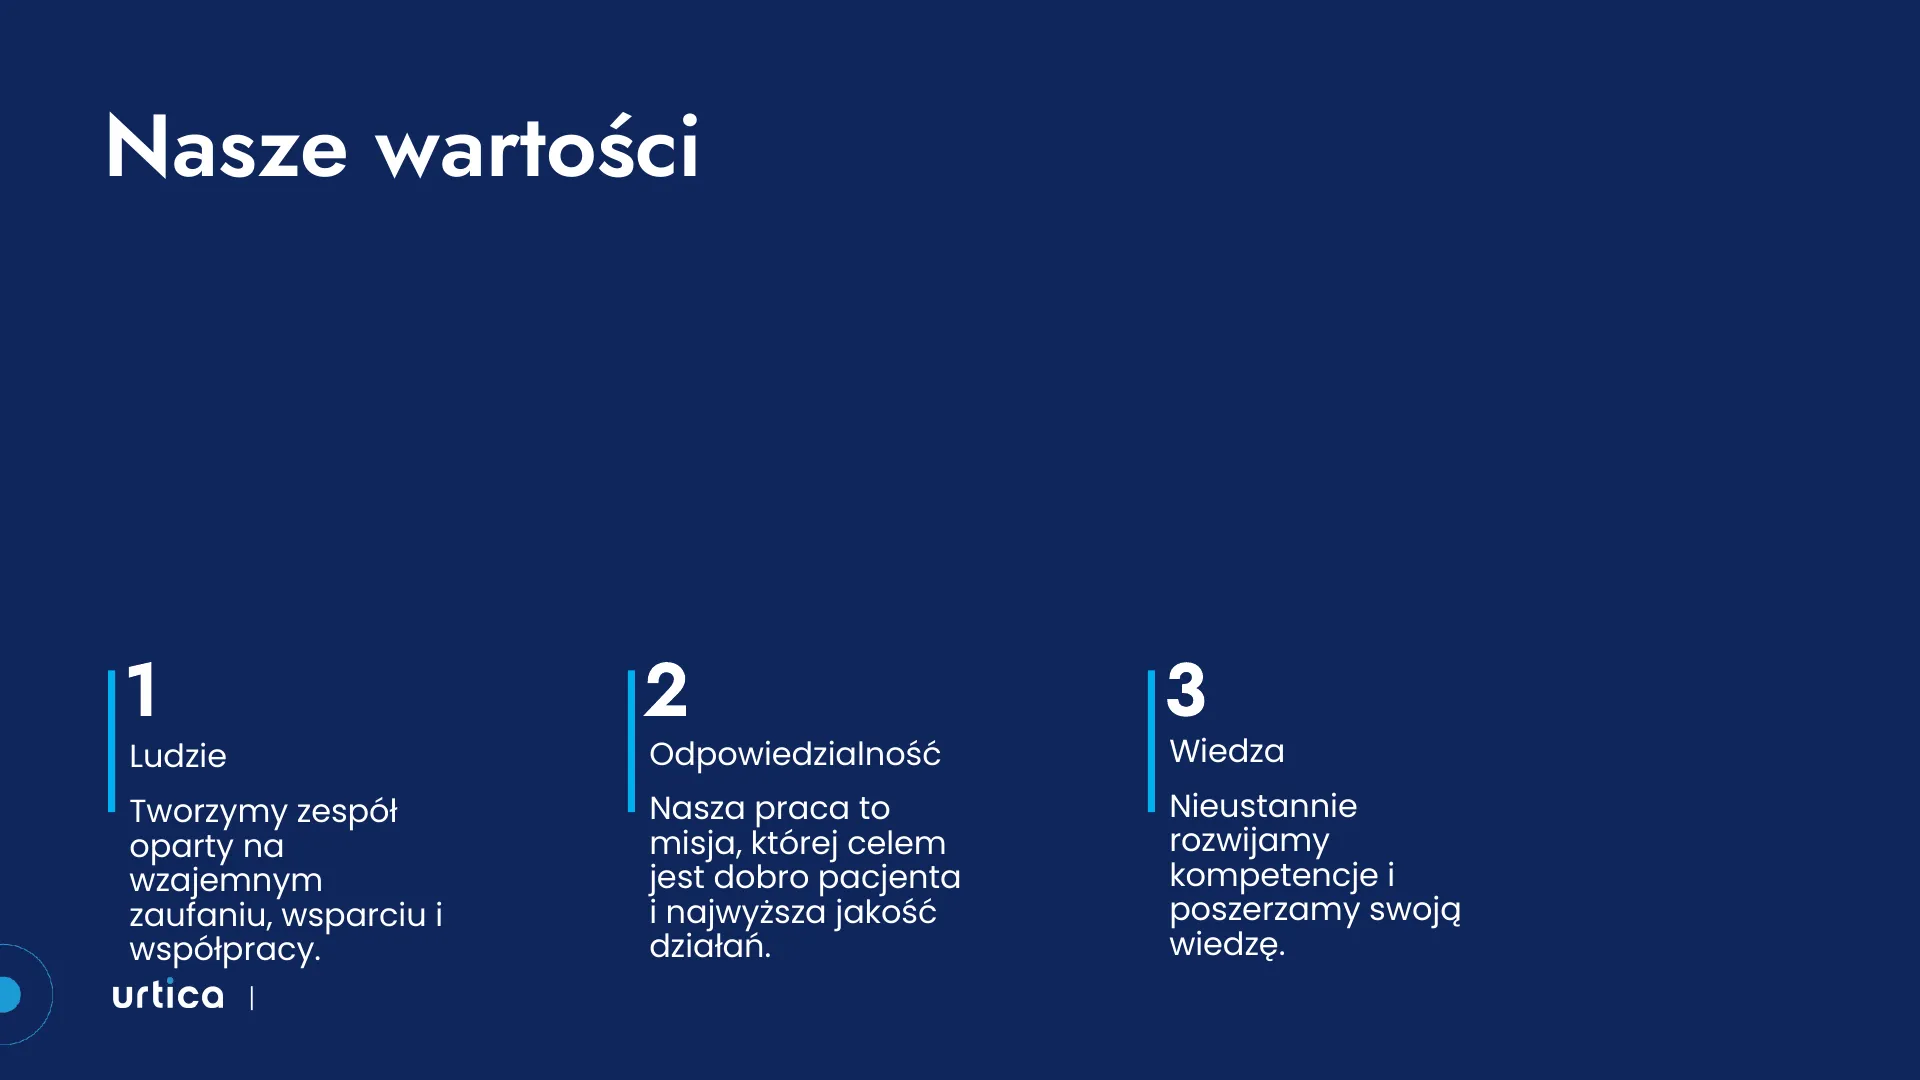 Old template
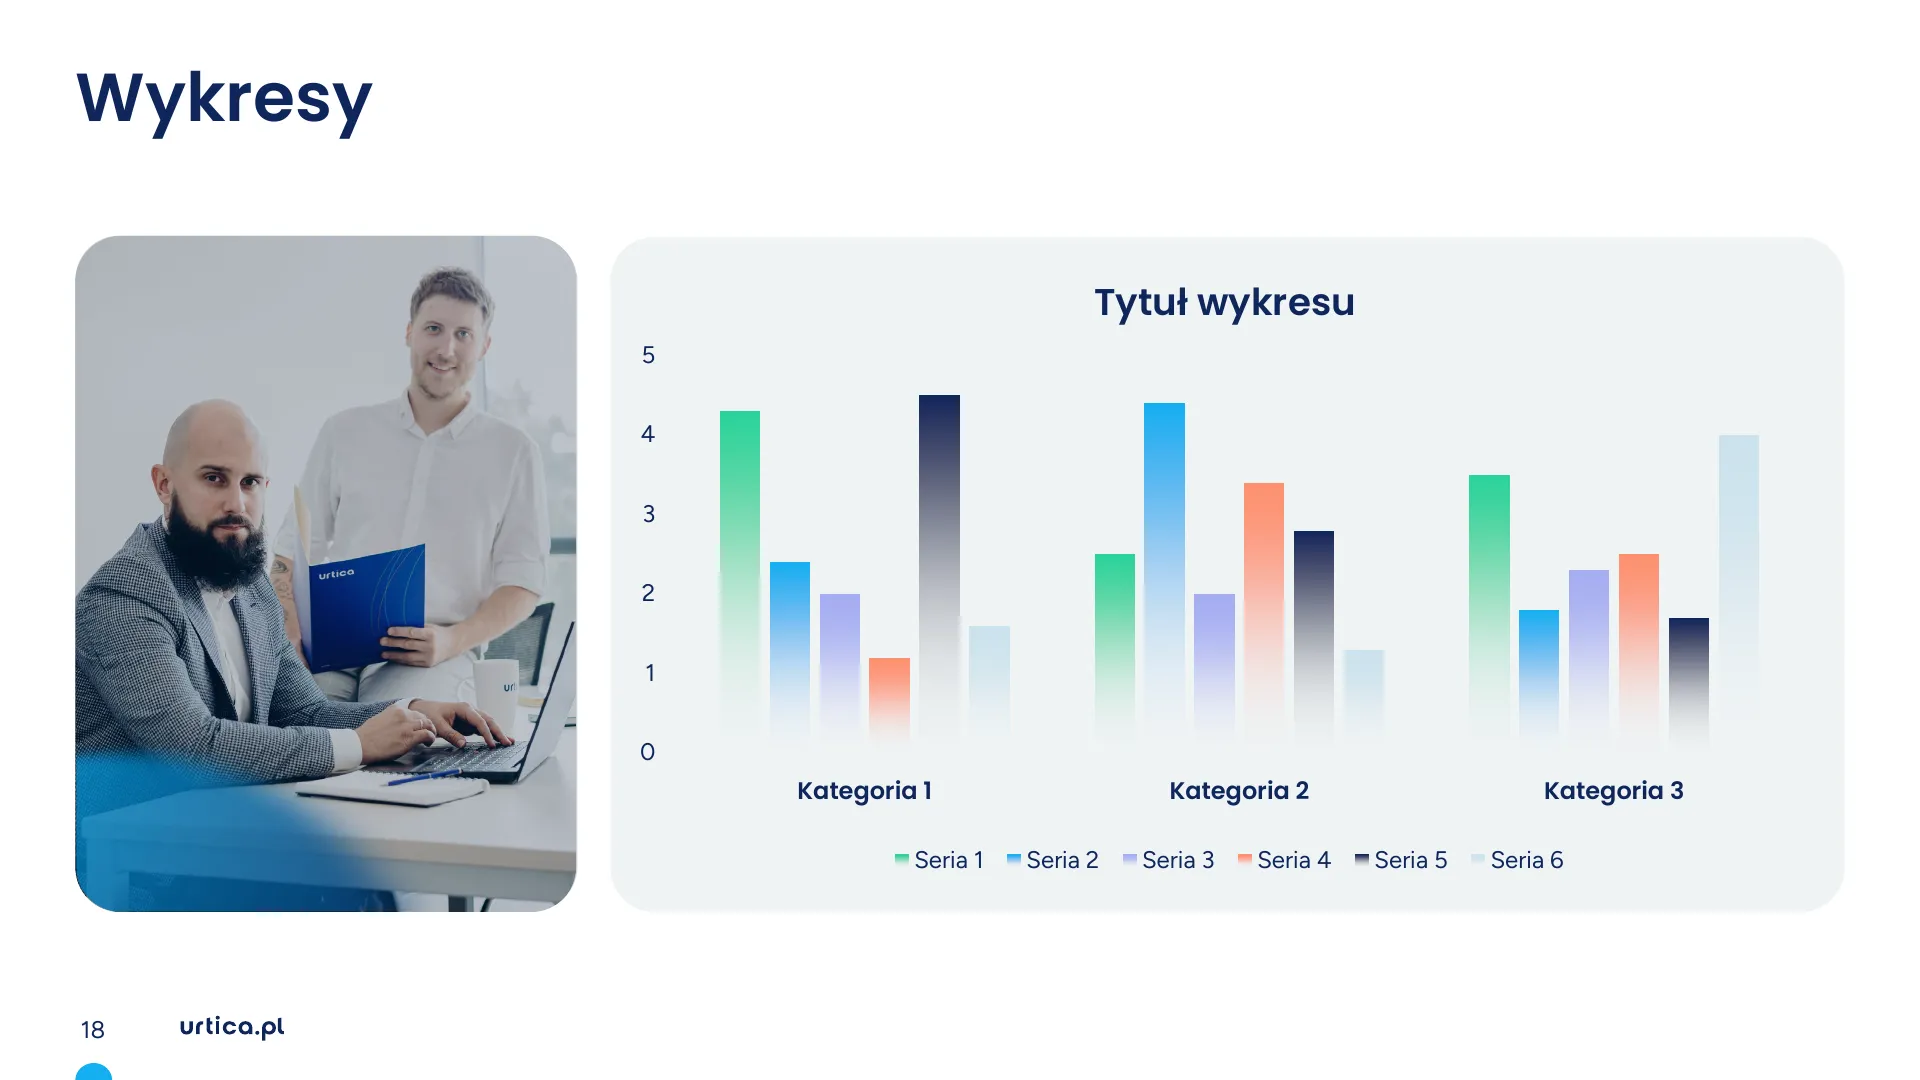 New template
 Old template
 New template
 Old template
04Data
Finance changes the numbers, the slide keeps its shape.
A presentation for the board or investors is rarely finished once and for all. Results keep coming in until the last minute, so we link charts and tables to the spreadsheet the numbers come from. The finance team corrects the data in Excel, the slide updates, and the chart, title and everything else stay where they are. Try it with the sample data.
| A | B | |
| Quarter | Revenue, PLN m | |
|---|---|---|
| Q1 | ||
| Q2 | ||
| Q3 | ||
| Q4 | ||
| Total |
Fourth quarter was the year's best
- 24.6 Q1
- 27.9 Q2
- 26.3 Q3
- 31.8 Q4
Revenue for the year 110.6 PLN m
Change from Q1 to Q4 +29%
Source: Results.xlsx, Quarters sheet, B2:B5
What we set up in these files
- Charts and tables linked to a spreadsheet in Excel or Google Sheets
- Fields with room for longer numbers, currencies and translations
- A locked logo, grid and colours, so nothing shifts
- A note on which cell goes to which slide
05Sales
Sales reps don't wait for a designer.
A sales presentation outlives a single meeting: the rep shortens it, adds slides for the client and sends it after the call. That's why we design it together with a slide library, from which sales can put together a version for the next conversation on their own.
In the sales kit
- A company presentation in a long and a short version
- A slide library: offer, case studies, figures, contact
- Language versions in the same layout
- A PDF to send after the meeting
- A one-pager and a proposal in the same style
Materials our clients sell with
-
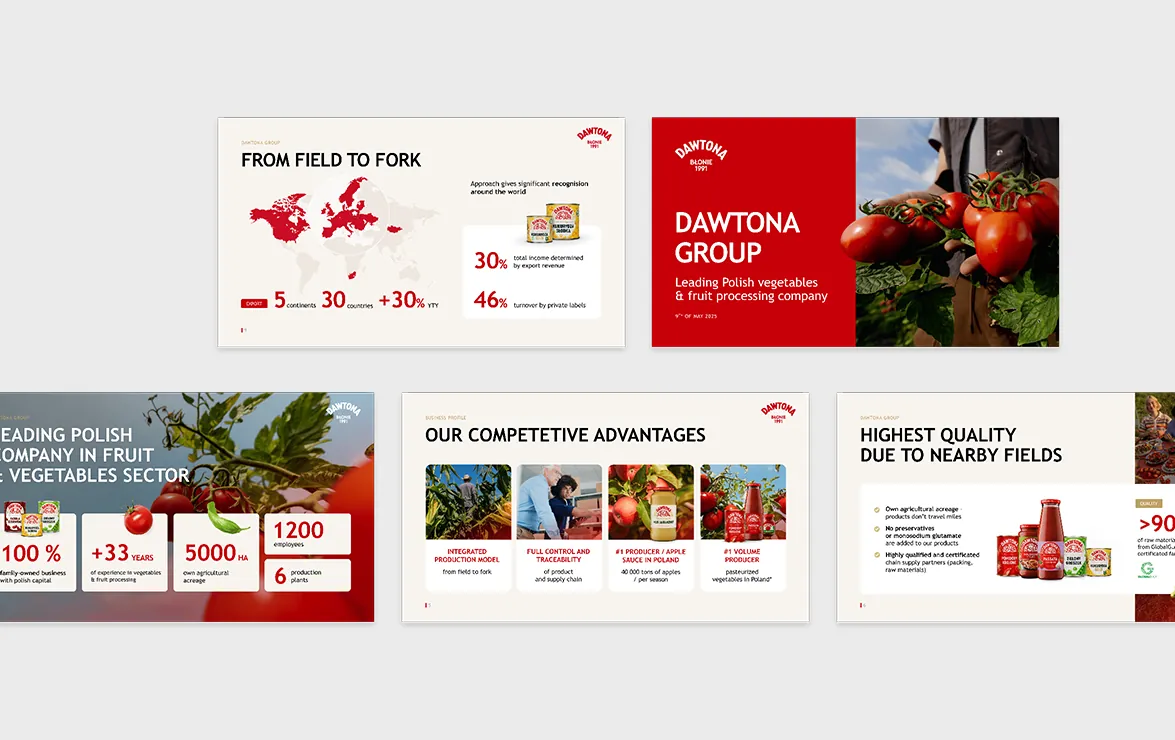 Dawtona Group
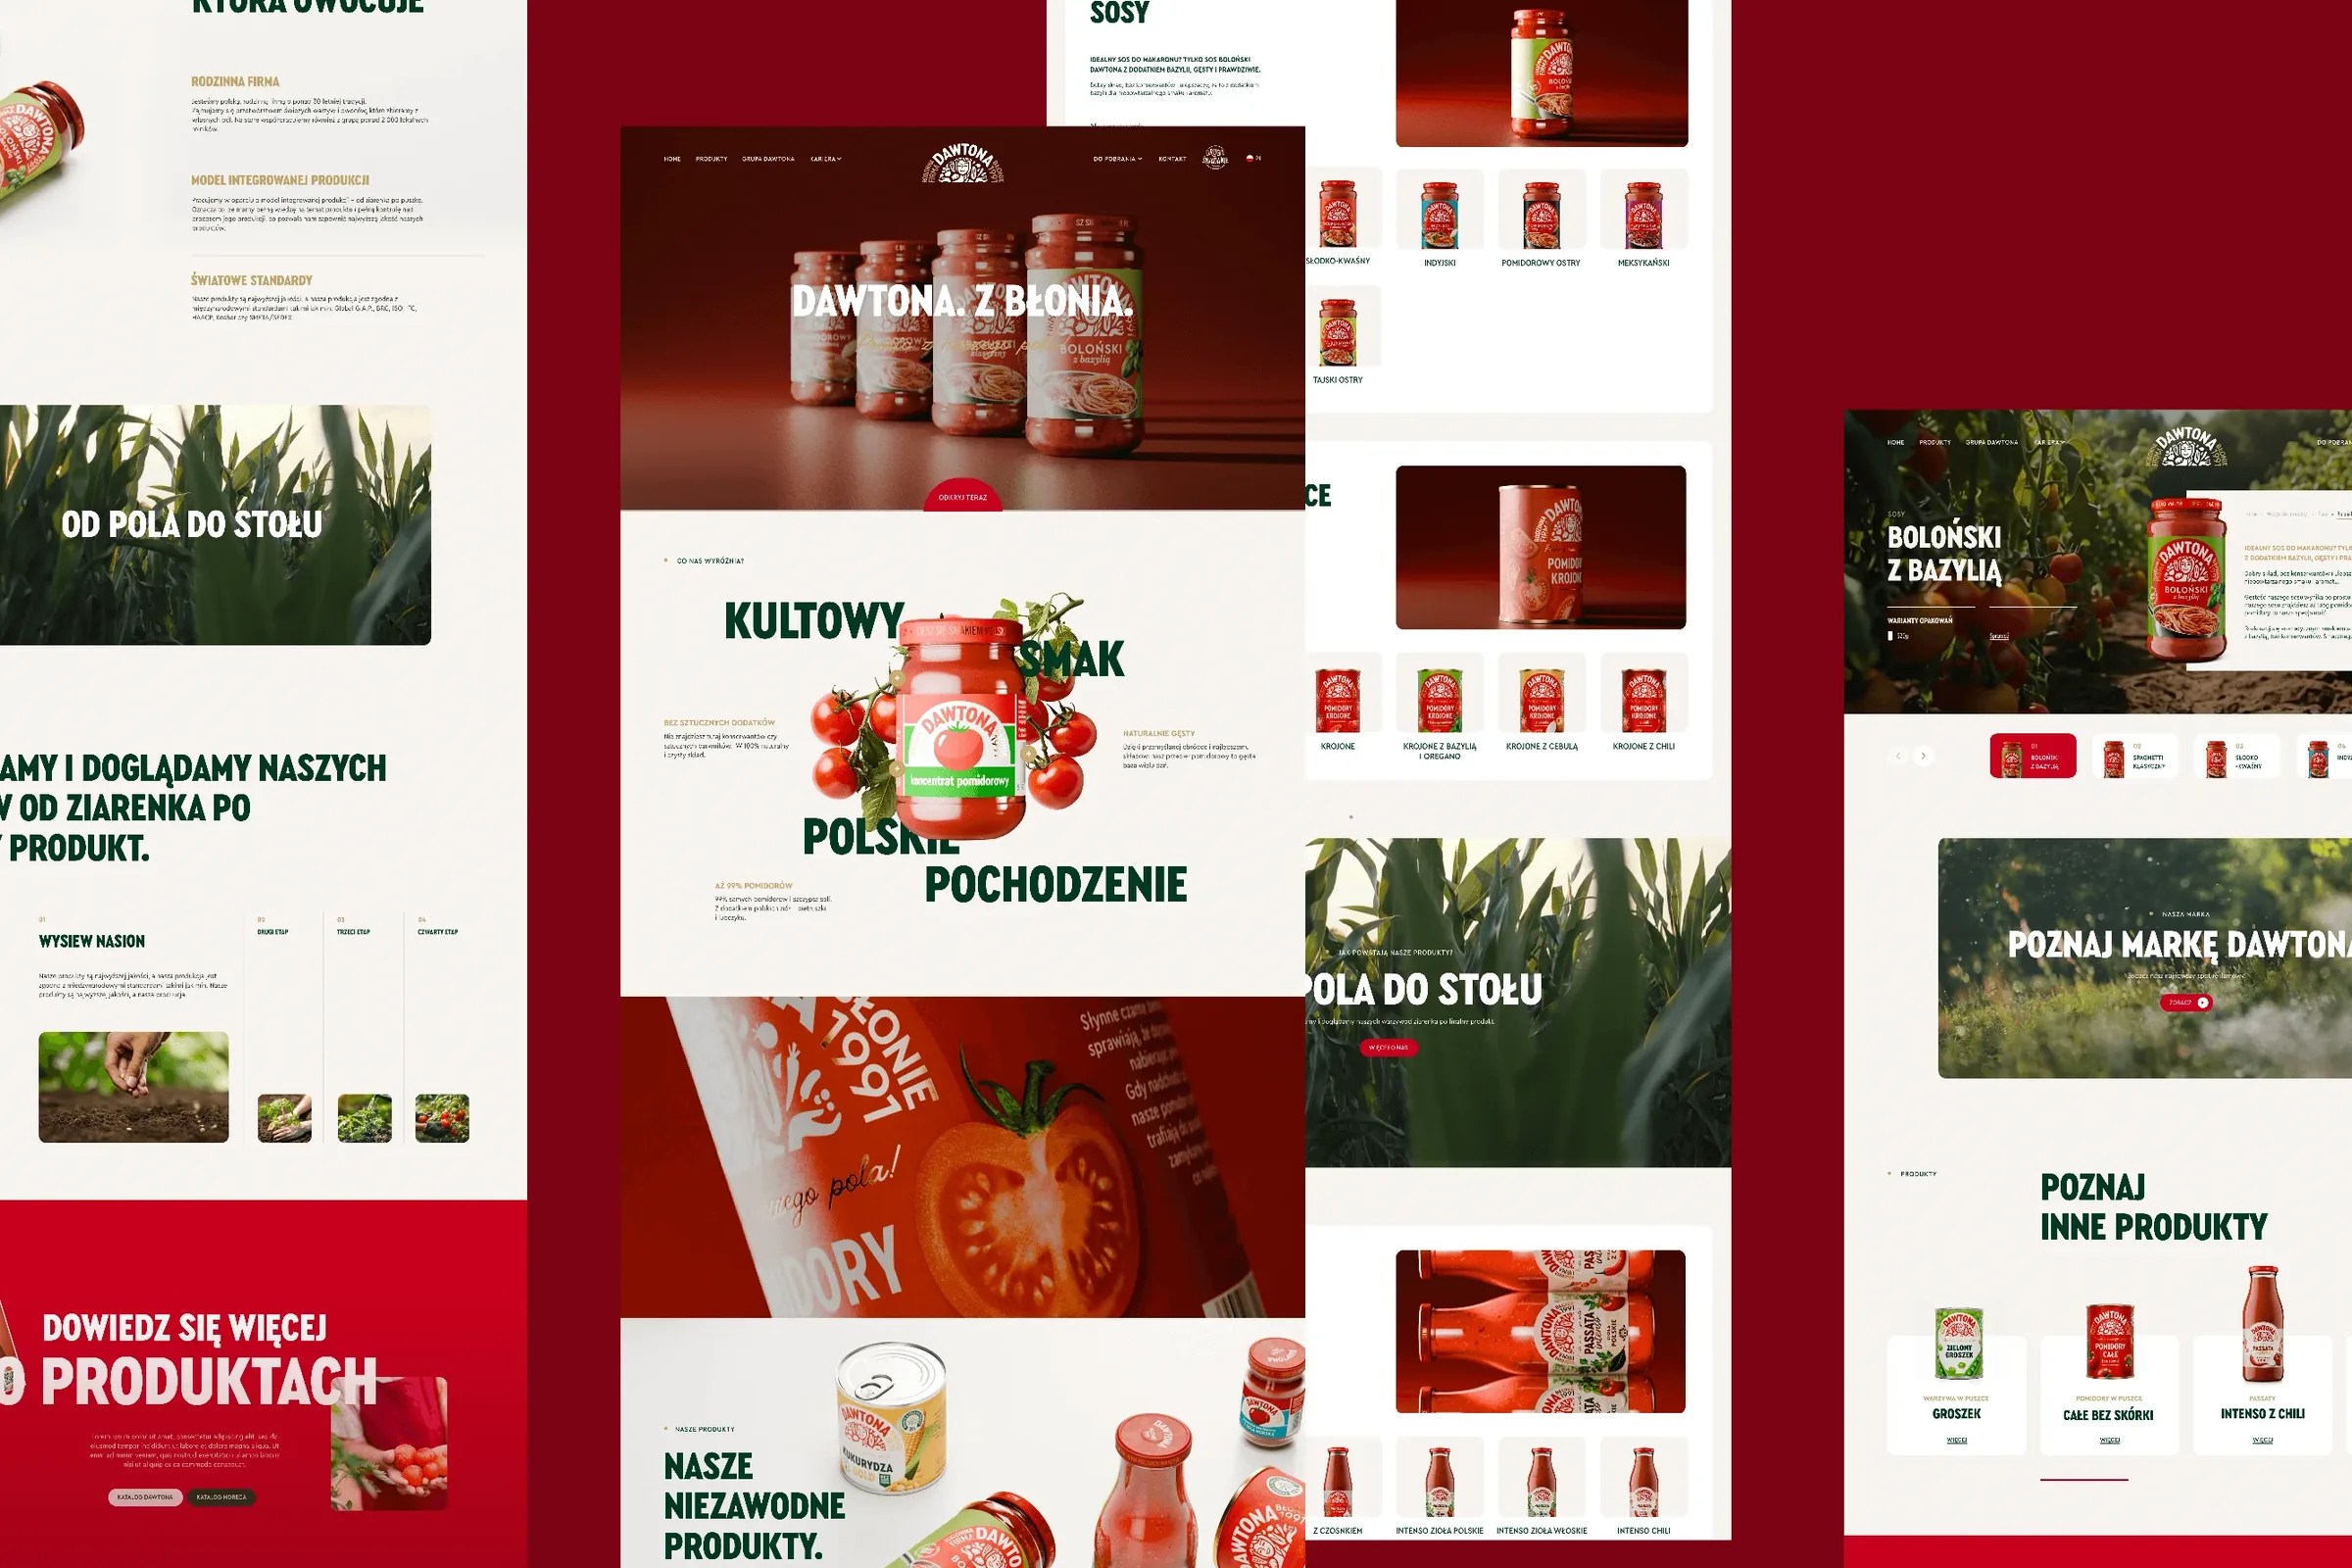
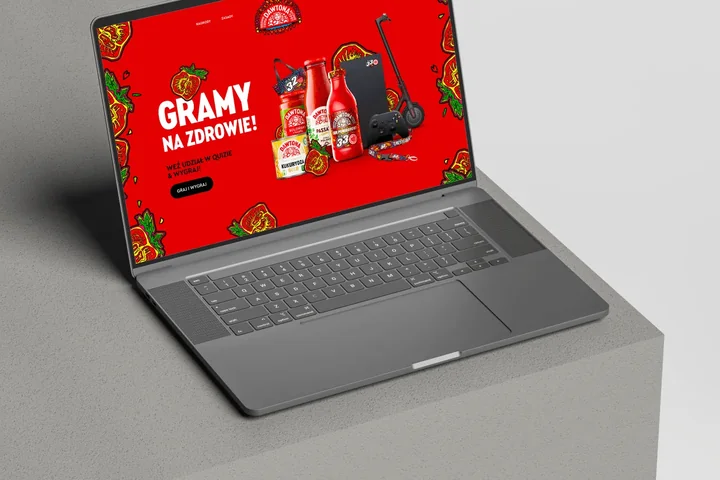
Over 10 presentations for the trade and partners, in which Dawtona counts hectares and export countries. One of them has 45 slides, in Polish and English.
-
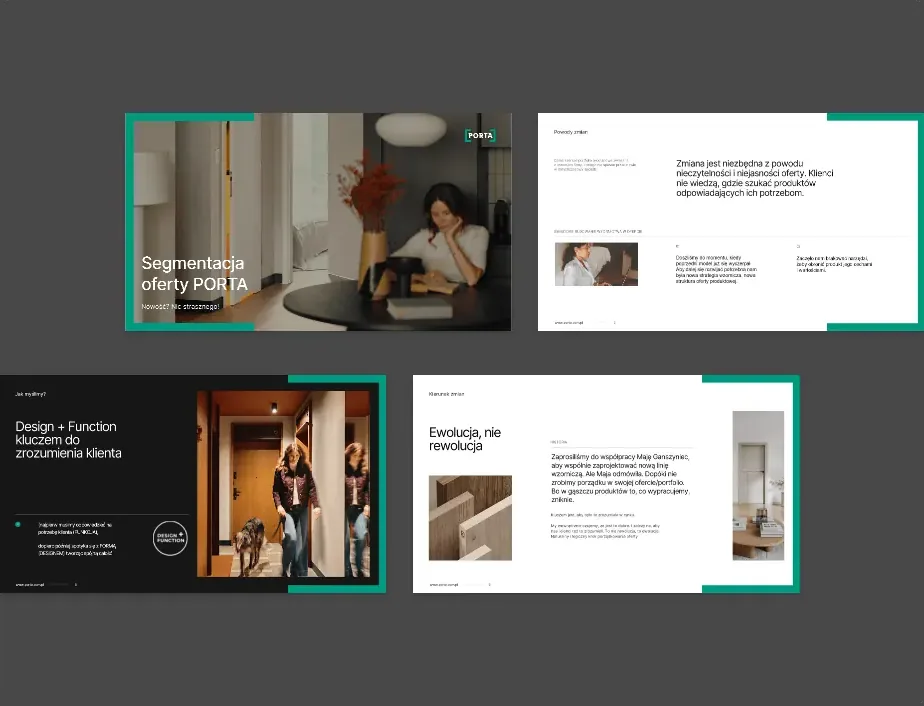 Porta Drzwi
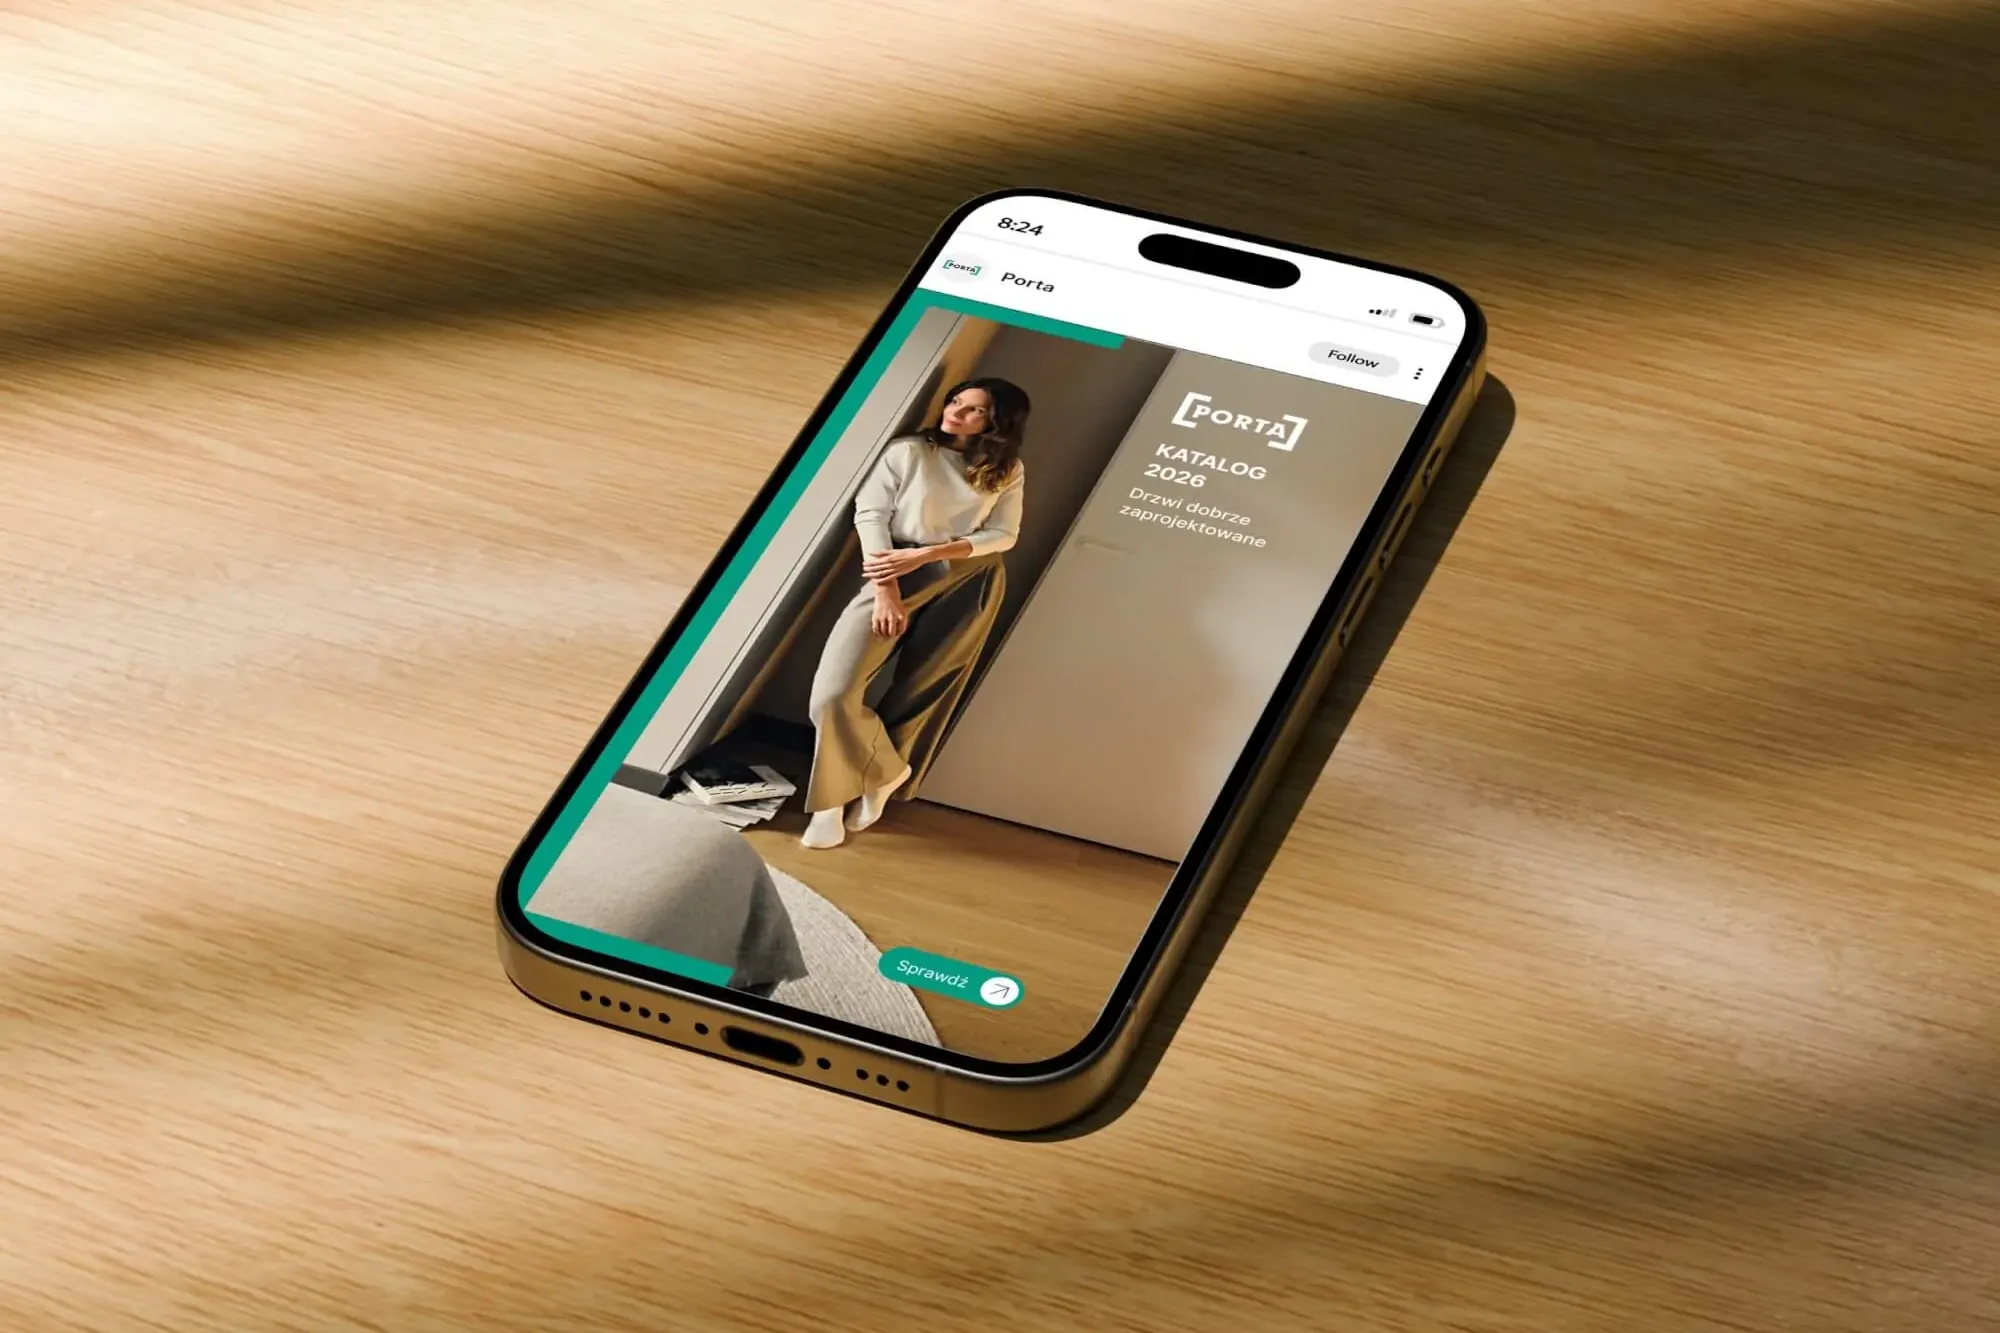
The sales presentation template uses what Porta's team already knows from the brandbook: the green frame, typography and colours.
-
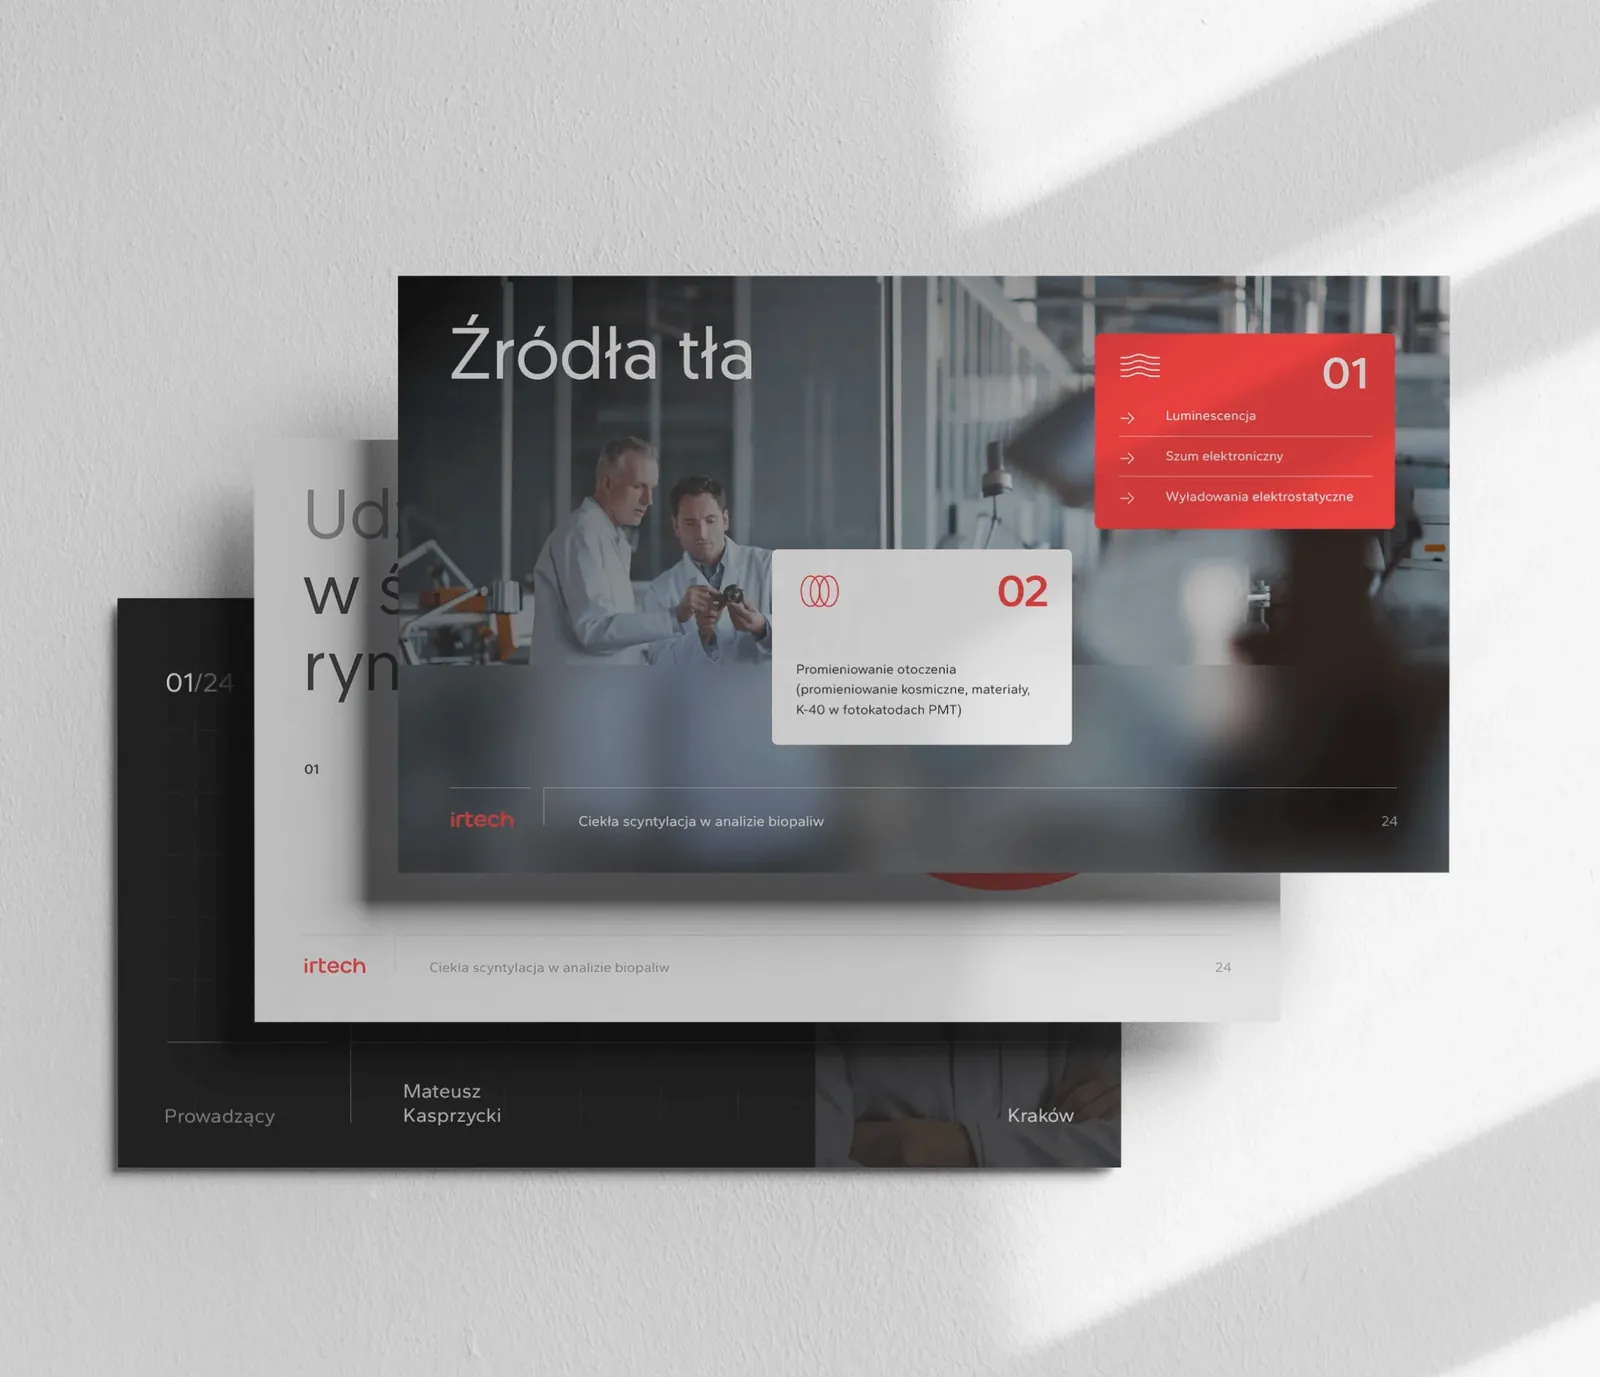 irtech
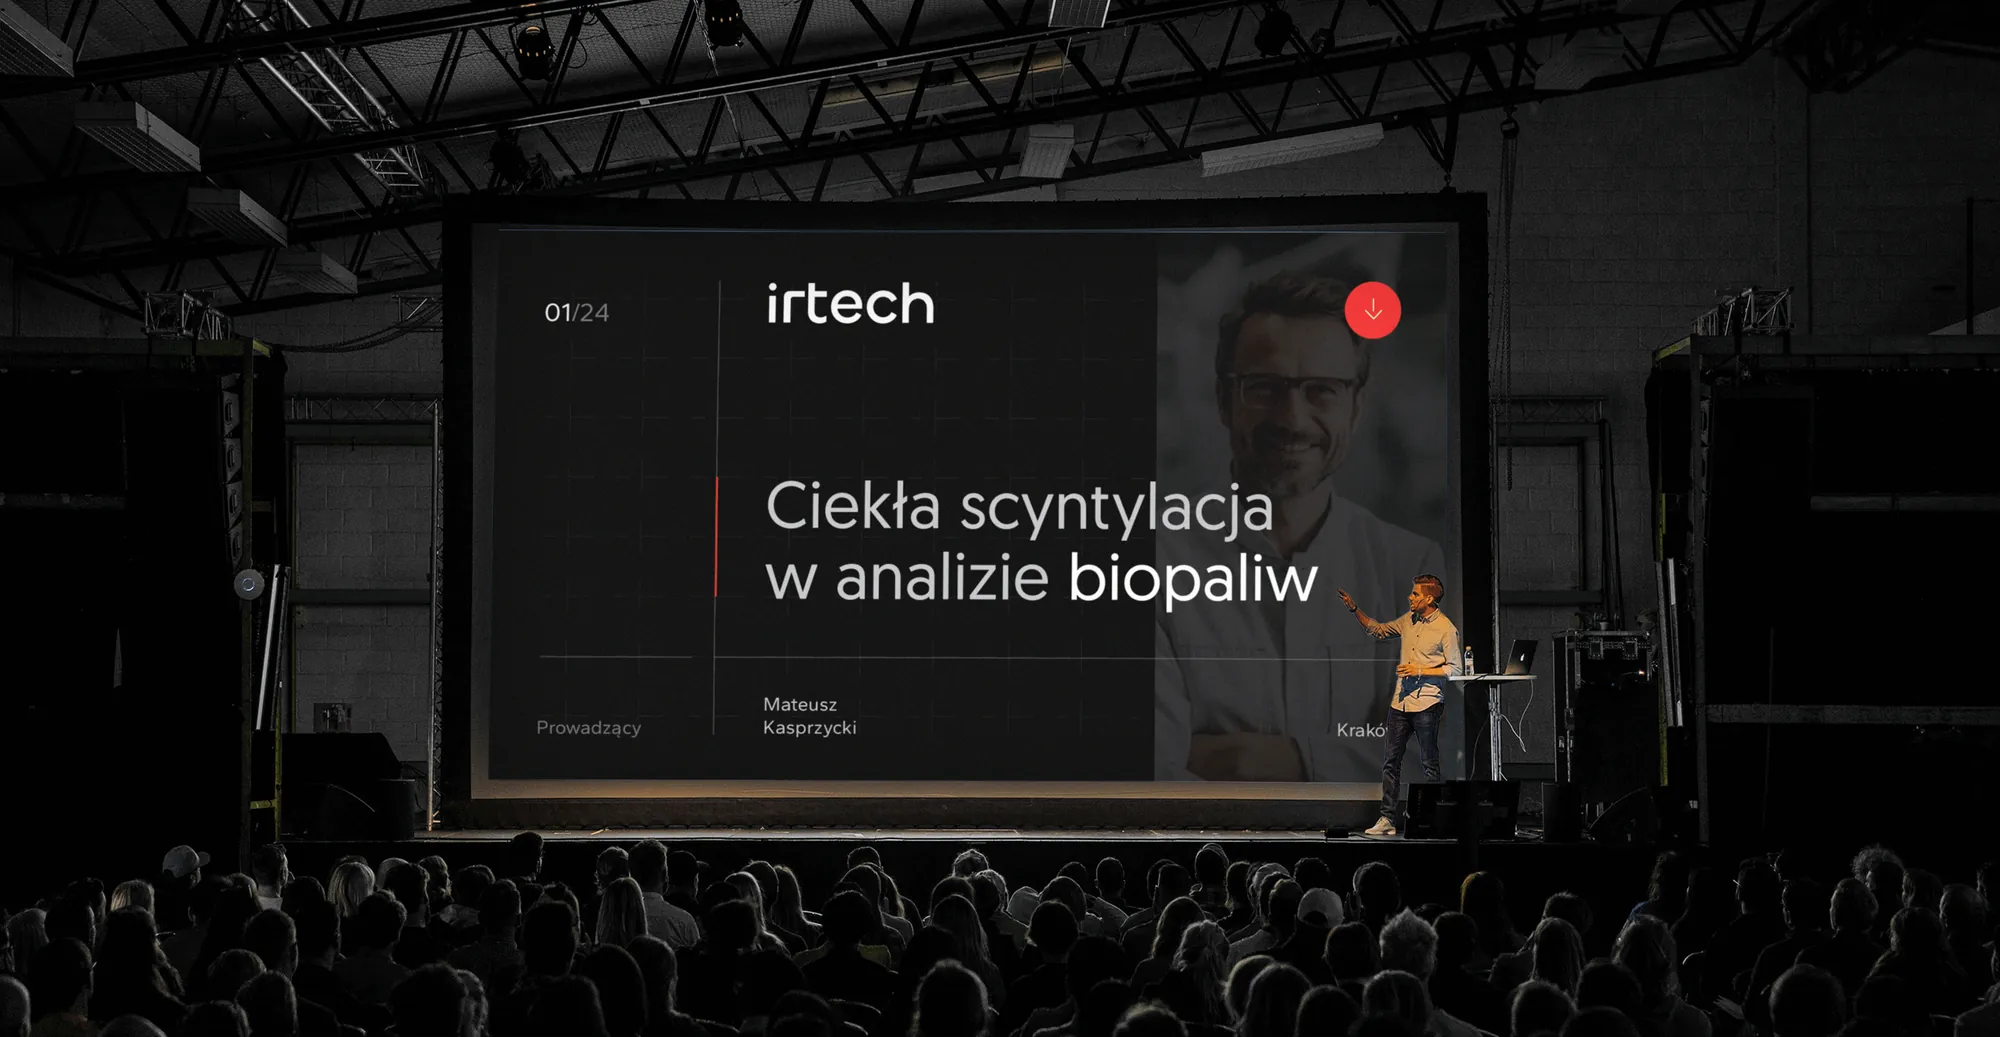
The sales presentation is one of over 20 templates the irtech team edits on its own, from a leaflet to a roll-up.
-
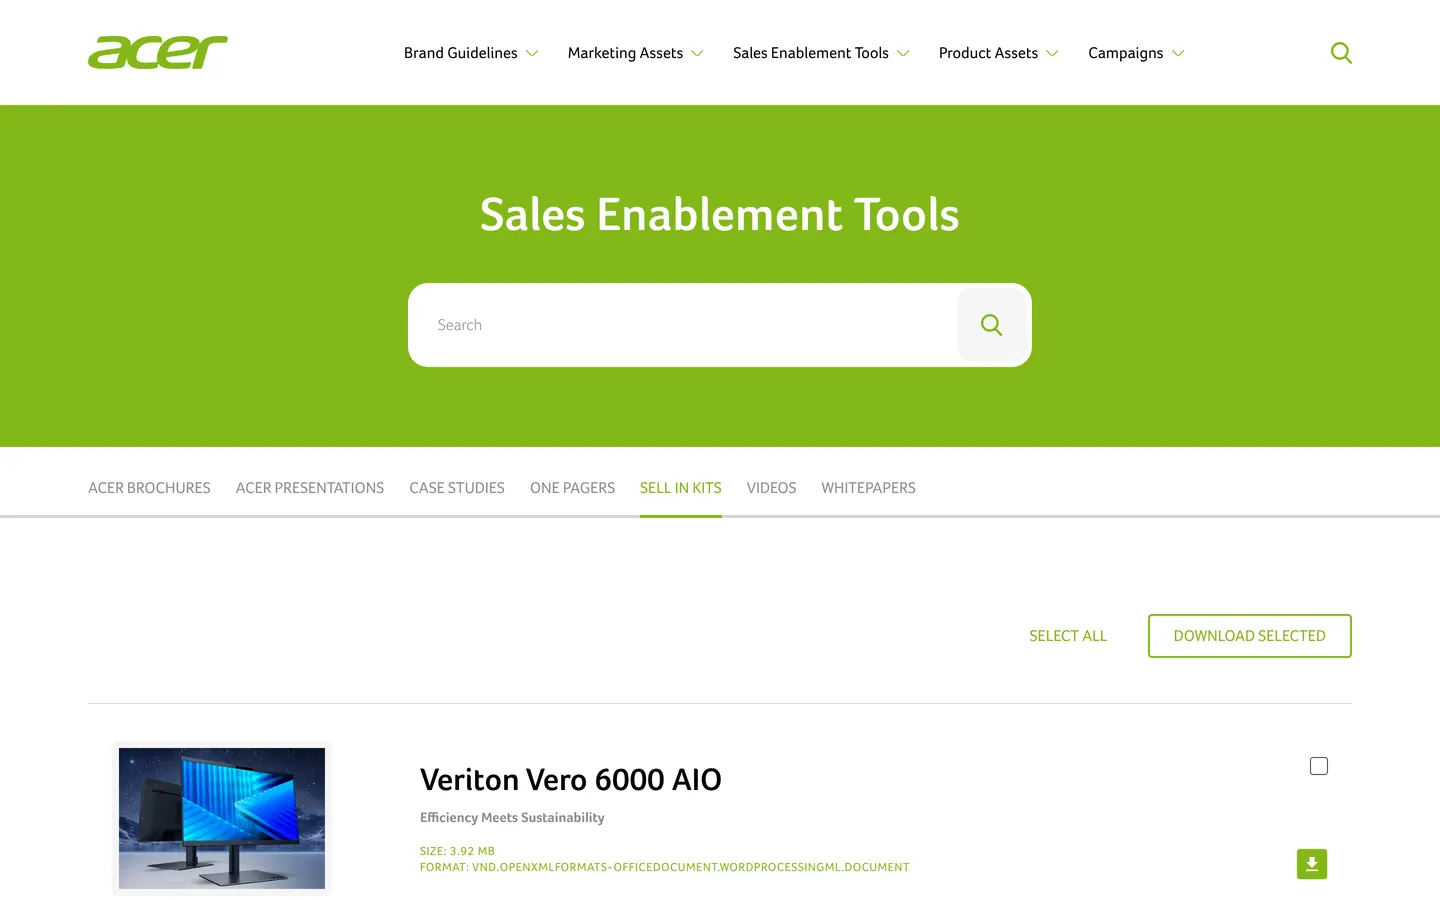 Acer
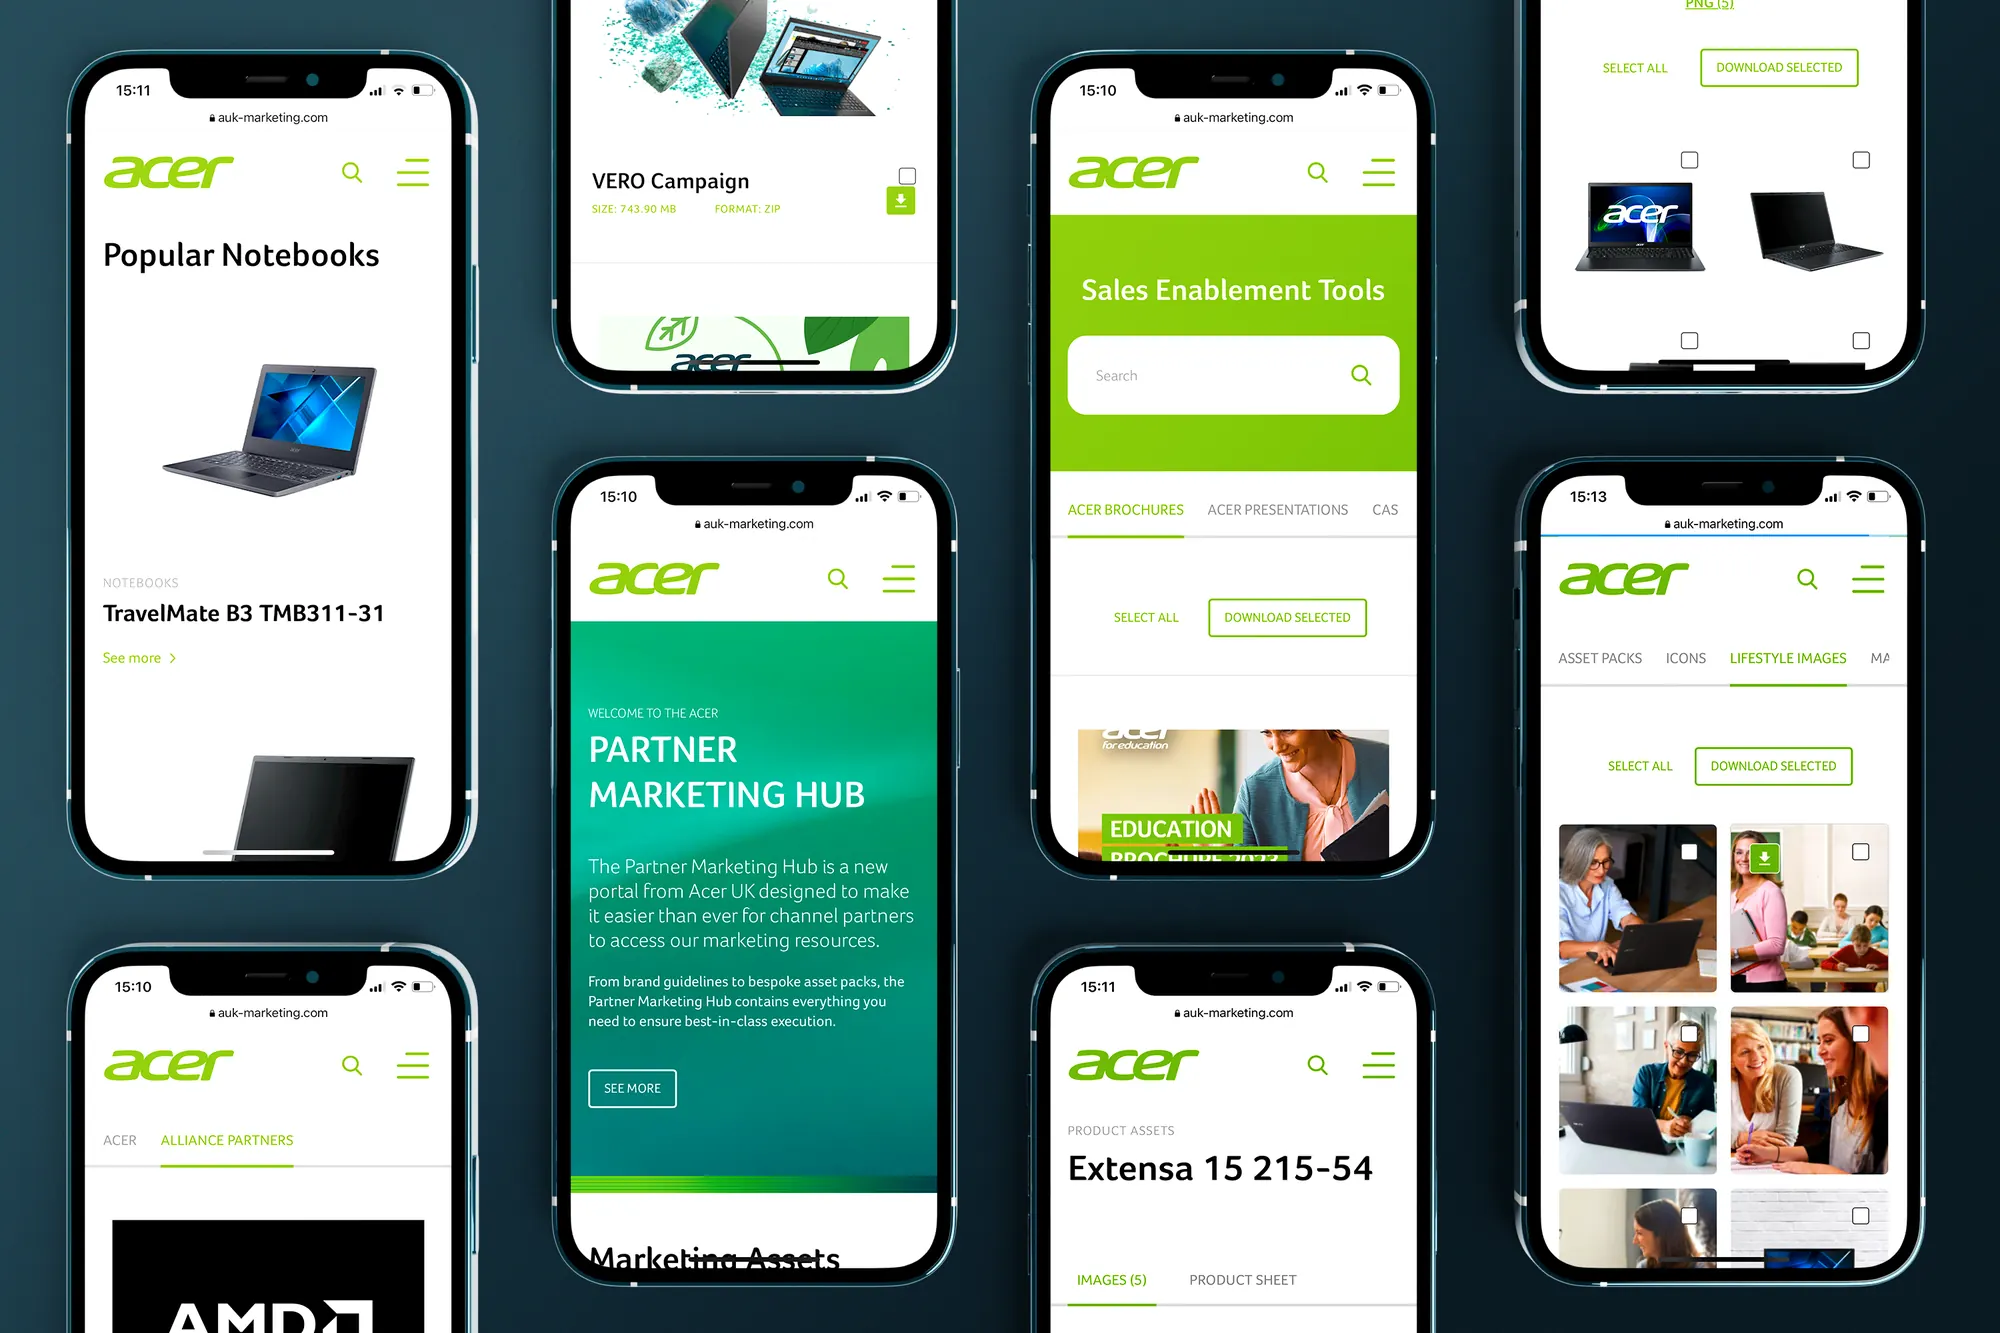
Acer's partners download presentations, logos and product photos themselves from the Partner Marketing Hub. Before, someone had to handle every such request by hand.
06Process
From outline to outcome.
Six stages, each ending with something you can review and approve. Before the start you know how the work will go, when you'll get what and what to expect at the end. For a presentation in an existing template the first two stages take a moment; for a new company presentation each one is a separate step.
- Stage 1 Goal and audience We agree who will be watching, where, and what they should take away.
- Stage 2 Storyline The outline becomes a slide plan: one idea per slide.
- Stage 3 Direction A few slides in the final style first, then the whole deck.
- Stage 4 Slide design We design all the slides, charts, diagrams and animations.
- Stage 5 Rehearsal We test the presentation out loud and with changed data.
- Stage 6 Template We hand over the file, slide masters and a guide.
Goal and audience
What we do
We agree who will be watching, where, and what they should take away.
We start with a conversation with the presenter or the team: who the presentation is for, where it will be used (a meeting, a stage, an email) and what the audience should take away from it. We check where the data will come from and who will update it, and for a talk also the screen: proportions, LED walls and the organiser's requirements.
What you get
- The goal and audience in two sentences
- Scope, number of slides and a quote
- A schedule up to the day of the presentation
Storyline
What we do
The outline becomes a slide plan: one idea per slide.
We sort out the outline, notes or old presentation, and break the presentation down into slides: what is said, what the screen shows, where a number, diagram or photo comes in. The texts are cut down to what really has to be on the slide.
What you get
- A slide plan with the order of topics
- Shortened texts for the slides
- A list of photos, diagrams and charts
Direction
What we do
A few slides in the final style first, then the whole deck.
We design the cover and a few key slides: a number, a chart, a diagram and a photo. On these we settle the style and check that the masters will cover every type of slide, before designing the whole deck. If the company has an identity, we follow its rules; if it doesn't, we propose a simple system.
What you get
- The key slides in the final style
- The style of charts, icons and photos
- A decision on direction before the full design
Slide design
What we do
We design all the slides, charts, diagrams and animations.
We design slide by slide: charts linked to your data, diagrams, icons and animations that help follow the thread. We make sure the text can be read both on the screen in the room and on the client's laptop.
What you get
- The full set of slides for review
- Charts linked to the spreadsheet, diagrams and icons
- Animations and transitions in the file
Rehearsal
What we do
We test the presentation out loud and with changed data.
Feedback is collected in comments and applied in rounds. A rehearsal out loud works best: it's immediately clear which slide is too dense. We also swap numbers in the spreadsheet to see whether the charts and tables hold their layout, and before the show we test the file on the equipment it will be shown on.
What you get
- Revision rounds with a list of changes
- Charts tested with changed data
- A backup PDF version
Template
What we do
We hand over the file, slide masters and a guide.
You get the presentation in the software your team works in, a PDF version for sending and, if ordered, a template with slide masters, an icon library and a short guide. Your team can prepare the next presentations on its own.
What you get
- The presentation in your software and as a PDF
- A template with slide masters
- A guide and an icon library
07Questions
Before you get in touch.
Which software will we get the presentation in?
Whichever your team works in: PowerPoint, Google Slides, Canva or Figma. For sending, and just in case, we add a PDF that looks the same on every computer.
Can we add more slides ourselves later?
Yes, that's what the template is for. Colours, typefaces and layouts are saved in the slide masters, so a new slide looks like the rest straight away. There's a short guide too and, if you like, a session where we show your team how to use it.
Will you write the slide content as well?
Yes. We can start from an outline, an old presentation or a conversation with the presenter. We sort out the storyline, shorten the texts and suggest what to show as an image and what to say out loud.
Can charts take their data straight from Excel?
Yes. In PowerPoint we link charts and tables to an Excel spreadsheet, and in Google Slides to Google Sheets. When finance changes the numbers, the slide pulls in the new data, while colours, typefaces and layout stay the same. We add a short note to the file on which cell goes to which slide.
How long does a presentation project take?
A short presentation in an existing template takes a few days. A new company presentation with a template takes longer, depending on the number of slides, how ready the content is and the rounds of revisions. When the presentation has a deadline, we plan the schedule backwards from it.
How will we know what stage the project is at?
From day one you have a schedule: what will be produced at each stage, when, and what we need from you. After each stage we show the result and explain the decisions behind it, and we keep you posted on progress, including while we're waiting for data or approval.
Will you do animations and transitions?
Yes, in the file itself: a chart that grows, a diagram that builds step by step, smooth transitions between slides. When a video is needed, we make an animation or an explainer video.
Do you design for LED screens and unusual formats?
Yes. We design to the screen's proportions, from standard 16:9 to panoramas across several walls. For Porta's anniversary in Romania we prepared a template for the speakers and a show on three LED walls.
Can you prepare versions in several languages?
Yes. We design the layout with room for longer translations, and put the language versions in one file or in separate ones. For Grupa Dawtona, among others, we prepared a 45-slide presentation in Polish and English.
How much does a presentation design cost?
Every presentation is priced individually. The price depends on the number of slides, whether the content is ready, animations and language versions, and whether a template is needed. You get a quote after a short call and a look at the materials.