














PolTREG
The investor section on poltreg.bio: reports with a filter and year selection, general meetings, company documents, shareholder structure in charts, presentations and a publication calendar, in Polish and English.
See the PolTREG projectGood numbers deserve a good layout.
An annual report is read by the board, investors, analysts and journalists, and each of them is looking for something different. We design a template in the company's identity and typeset every new edition in it, with tables and charts you can read without a magnifying glass, on time, quarter after quarter.
Showreel with sound
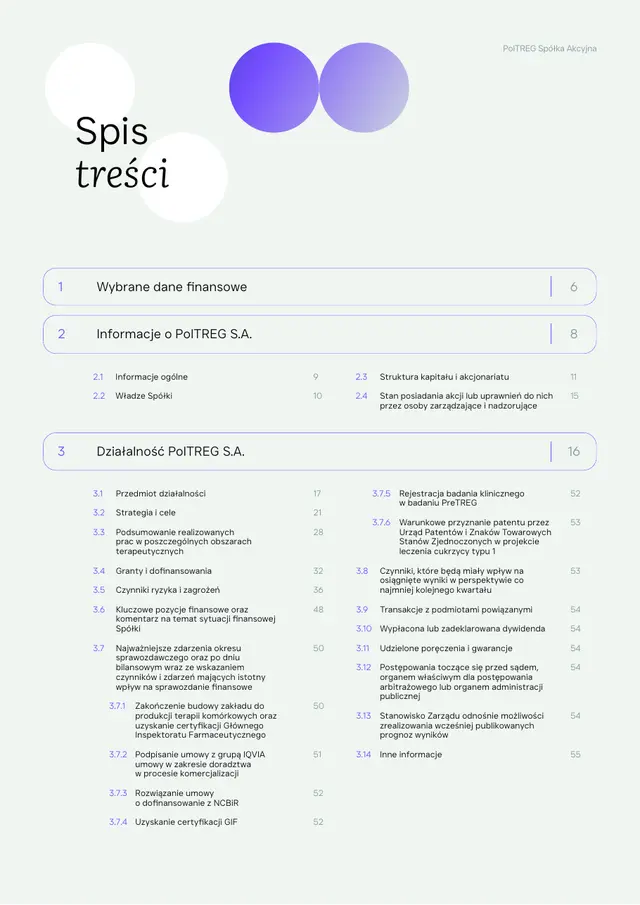
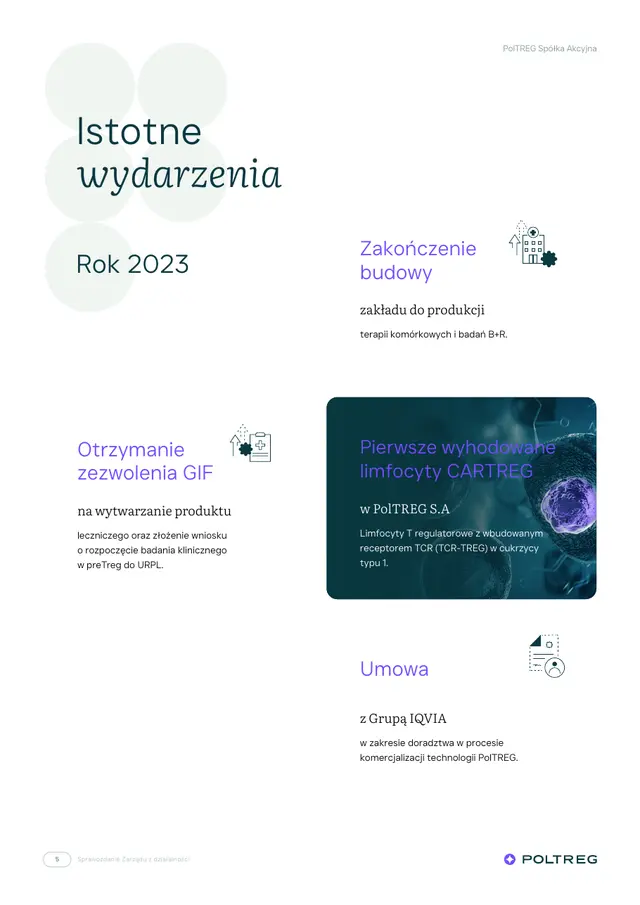
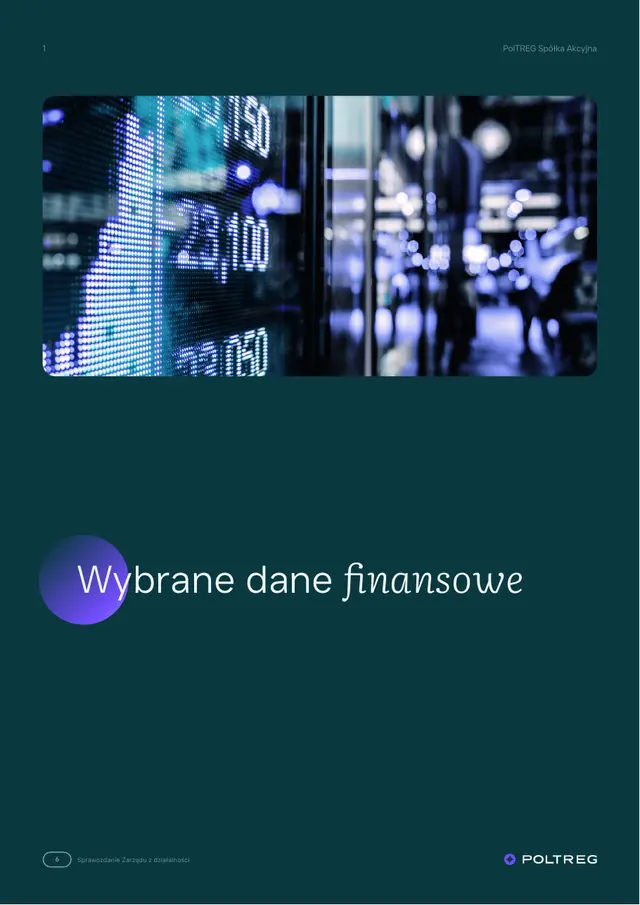
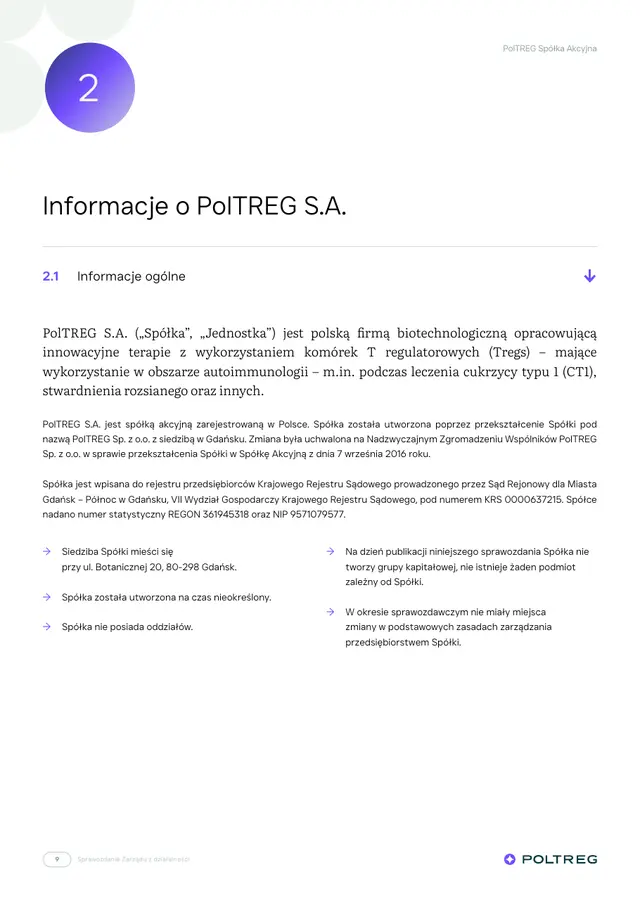
Cover
PolTREG · management report, 58 pages
01Approach
This is how we work on every report, from a quarterly of a dozen or so pages to an annual management report: to a schedule you know from day one. At every stage you know what we're doing, why and when.
We start with a template in the company's identity: the grid, typefaces, colours, and table and chart styles. We also build it in PowerPoint if the company wants to edit reports in-house. Every new edition comes together faster in it and looks as good as the first.
The board, investors, analysts and journalists all read the same report differently. We put the key figures up front, open each section with a distinct page and number the subheadings, so everyone finds their chapter quickly.
We set tables by rules every accountant knows and every reader appreciates: figures aligned right, the unit in the header, negatives in brackets, the current period highlighted.
We choose each chart for the question it has to answer: change over time is shown differently from a revenue breakdown. We draw it straight from the spreadsheet, in the company's colours and with the values labelled.
We split long blocks into shorter paragraphs, pull the most important sentences to the surface and explain difficult terms in boxes. The report then reads like a good article.
More and more people read reports on screen, so we also make interactive reports, with animated charts, a clickable table of contents and transitions between sections. Readers choose what to dig into.
A report has a deadline that can't be moved. We plan the schedule backwards from the publication date and stick to it until the last correction.
02What we design
These are the ones we design most often. For each: what we do, what you get and a project you can look through.
What we do
We design the cover, section openings, text layout, tables and charts, then typeset the whole thing in the company template. An annual report with an English version is set in the same layout, page for page.
What you get
What we do
Periodic reports come back every quarter, so speed and consistency matter. We typeset them in a ready template, or design a PowerPoint template in which the company swaps figures, tables and charts itself. The layout stays the one investors already know.
What you get
What we do
We turn data into charts and infographics that show a trend at a glance. We design a shared style for them, so a chart from the report can go into a presentation or onto the company website without changes.
What you get
What we do
A report read on screen can do more than paper. Charts draw themselves as you scroll, tables expand into detail, and the table of contents takes you to a section in one click. We design it in the company's identity, with the same figures as the print version.
What you get
What we do
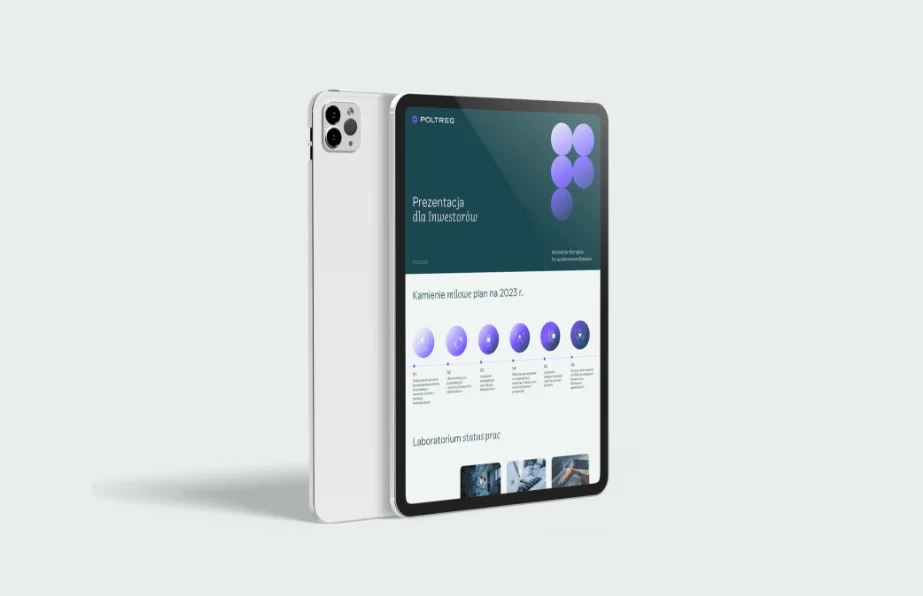
Results also need to be told. We turn the report into a presentation for an earnings conference, an online investor Q&A or a meeting with a fund, with the same colours and charts, plus a template in which your team can build the next one.
What you get
What we do
We design and build investor sections: reports with filters and an archive, a publication calendar, the shareholder structure and company documents. The company adds new reports itself, in the admin panel.
What you get
Similar projects
03Tables
A table from a spreadsheet can be pasted into a report in a minute. The reader then pays for it with a quarter of an hour spent hunting for their number. After typesetting, the same data reads at first glance.
Sample data
| Item | Current period | Previous period | Change |
|---|---|---|---|
| Income statement | |||
| Revenue from sales | 48,213 | 41,977 | +14.9% |
| Gross profit on sales | 15,860 | 13,402 | +18.3% |
| EBITDA | 9,742 | 8,115 | +20.0% |
| Operating profit | 6,318 | 5,204 | +21.4% |
| Net profit | 4,905 | 4,377 | +12.1% |
| Cash flows | |||
| From operating activities | 7,120 | 6,530 | +9.0% |
| From investing activities | (3,410) | (2,980) | −14.4% |
Figures aligned right. Equal-width digits sit one above the other, so thousands are compared with thousands.
The unit, once. Thousands of zloty stated in the header, with no “.00” in every cell.
Current period first. Highlighted in colour and a heavier weight, because that's where reading starts.
Negatives in brackets. Brackets are easier to spot than a minus sign, which gets lost in print.
Groups and subheadings. A subheading separates the income statement from cash flows, and unnecessary lines disappear.
Change as a bar. The direction and size of the change are visible before anyone reads the percentage.
04Template
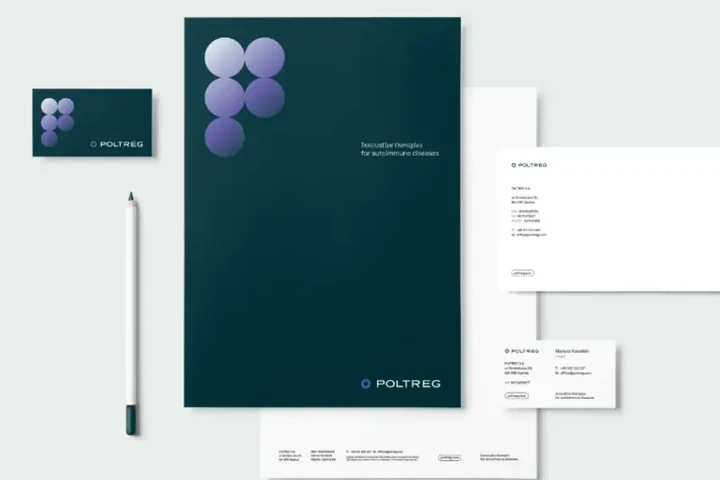
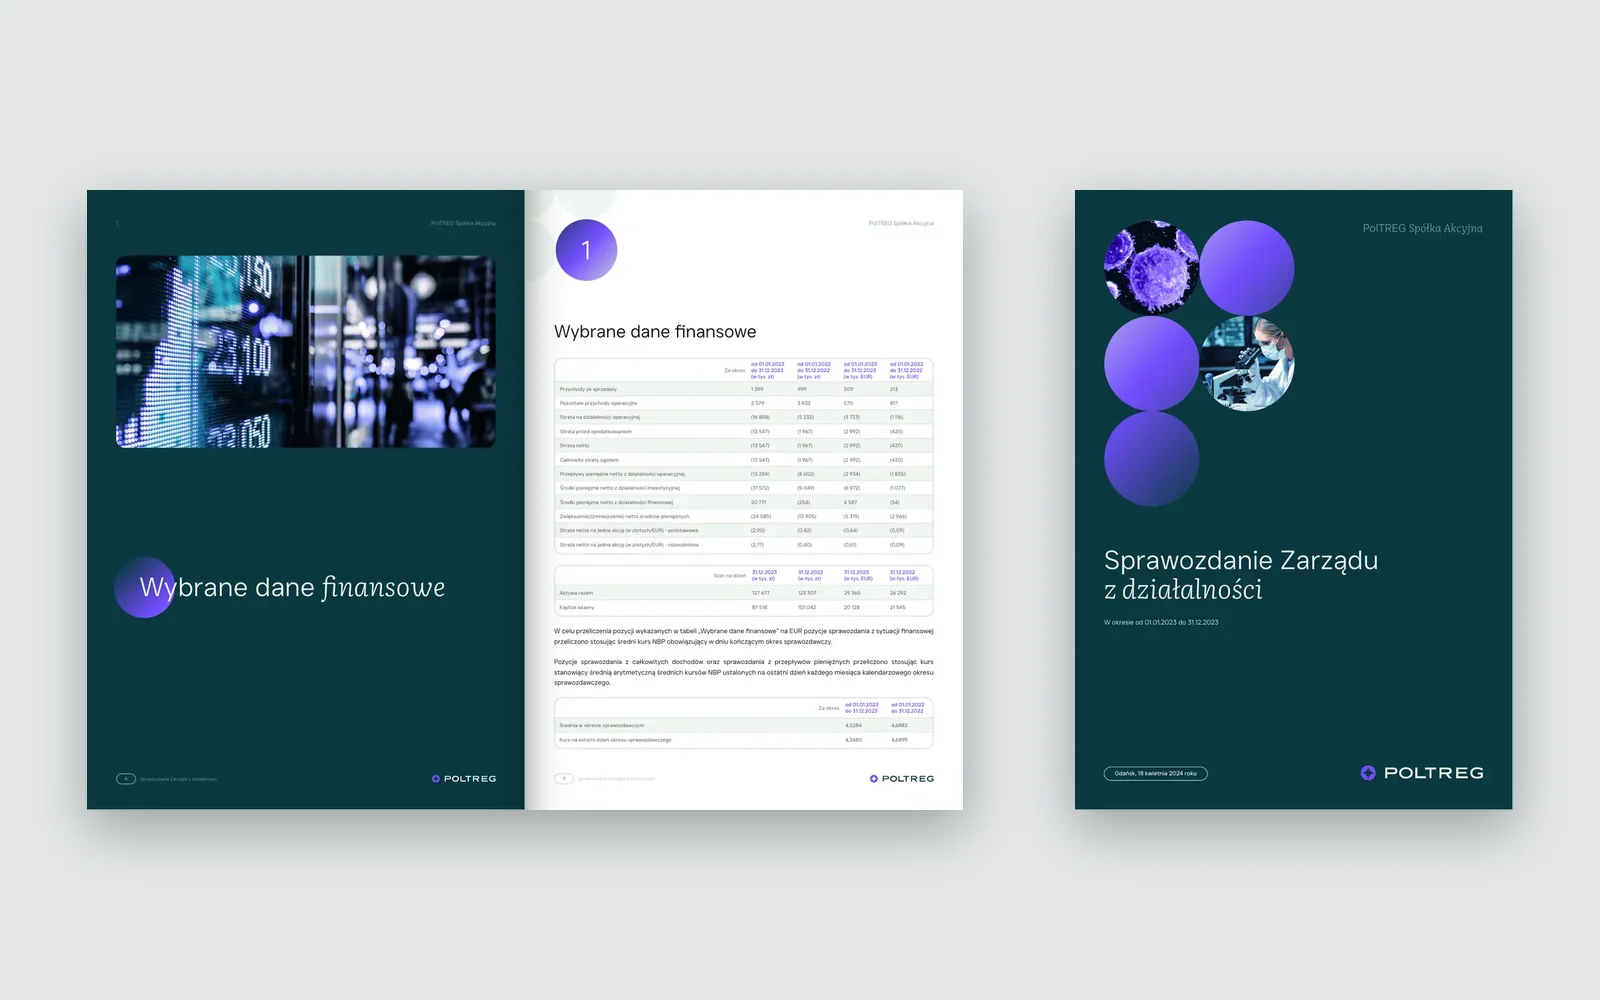
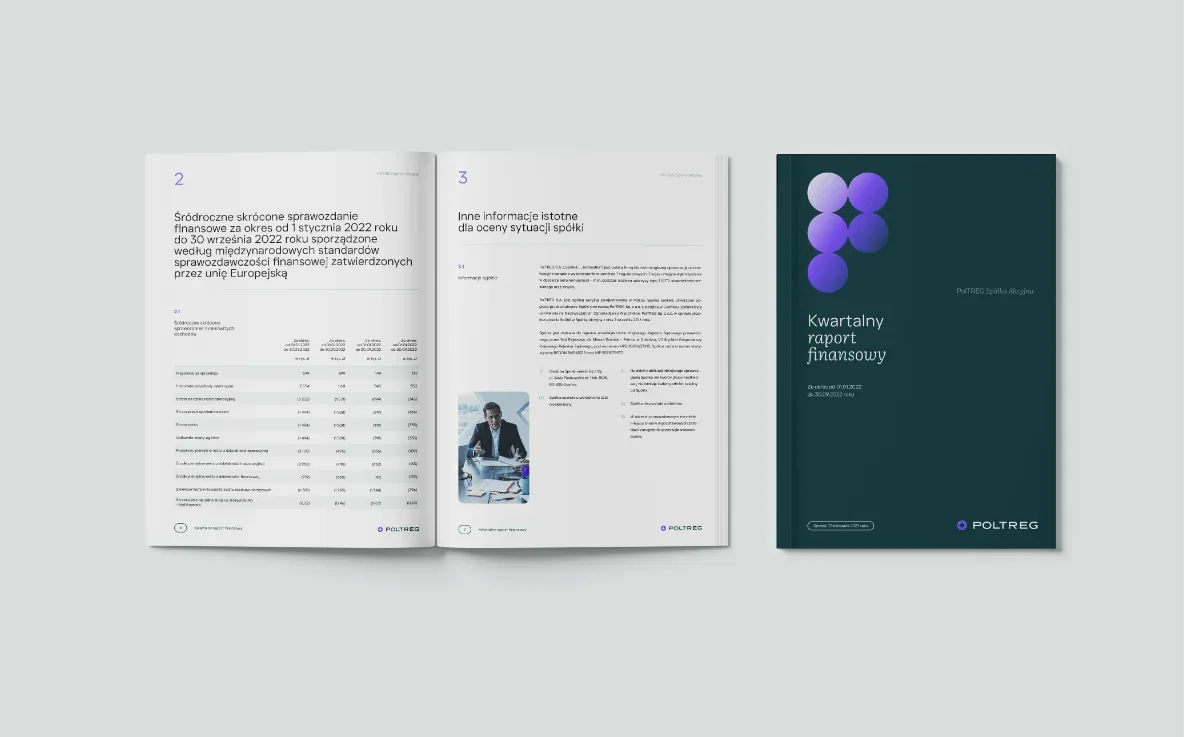
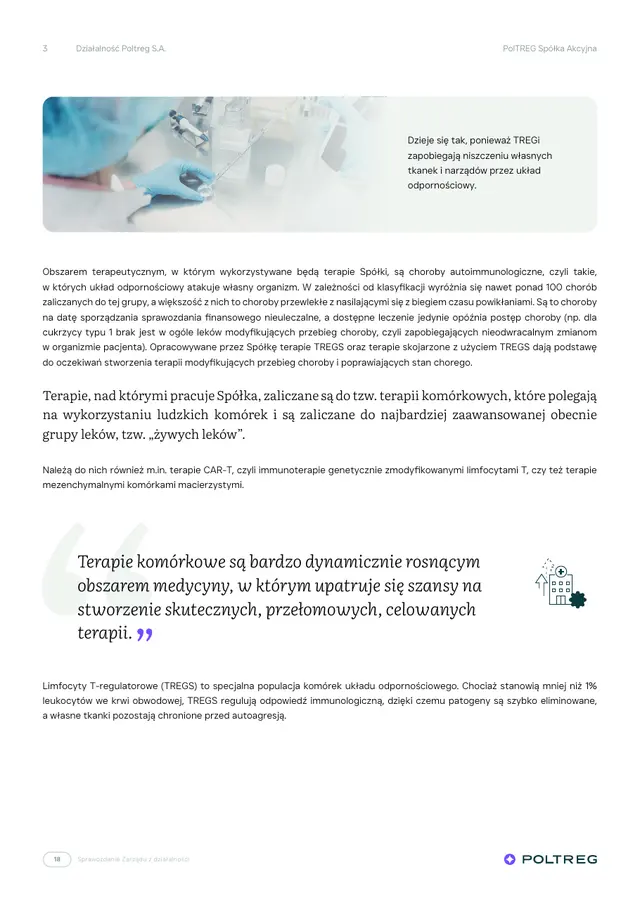
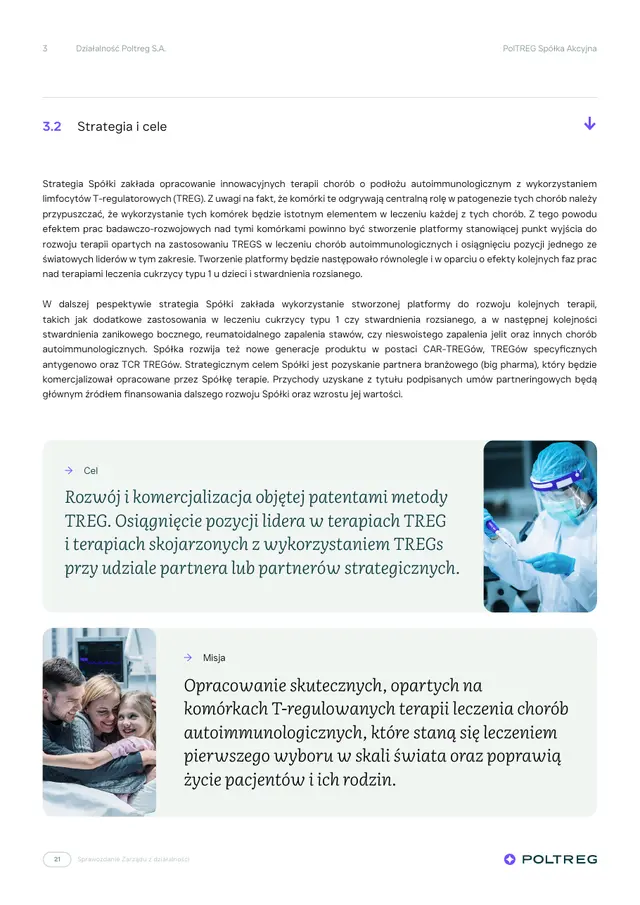
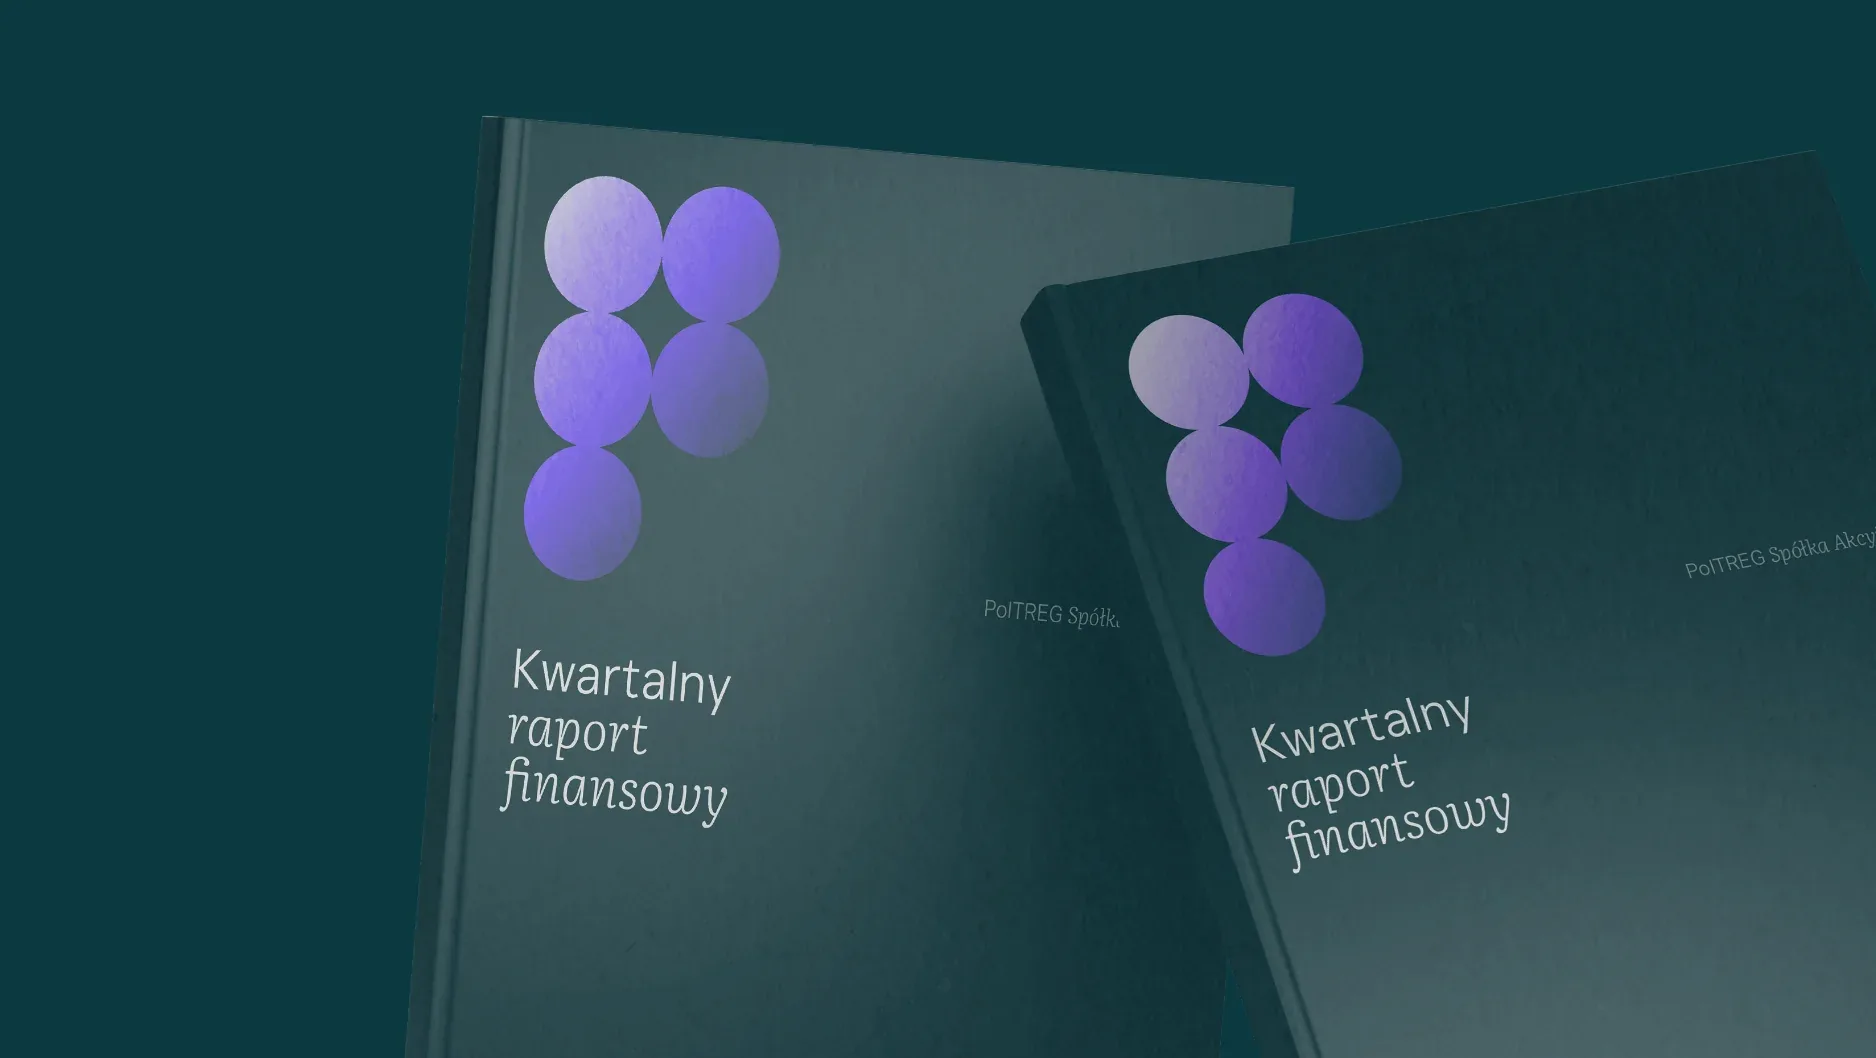
For PolTREG, a biotech company listed on the Warsaw Stock Exchange, we designed a report template in its new identity, entirely in PowerPoint. The company edits each new edition itself, quarterly, half-year and annual: it swaps figures, text and charts, and the layout stays in place. Here's what it looks like inside.
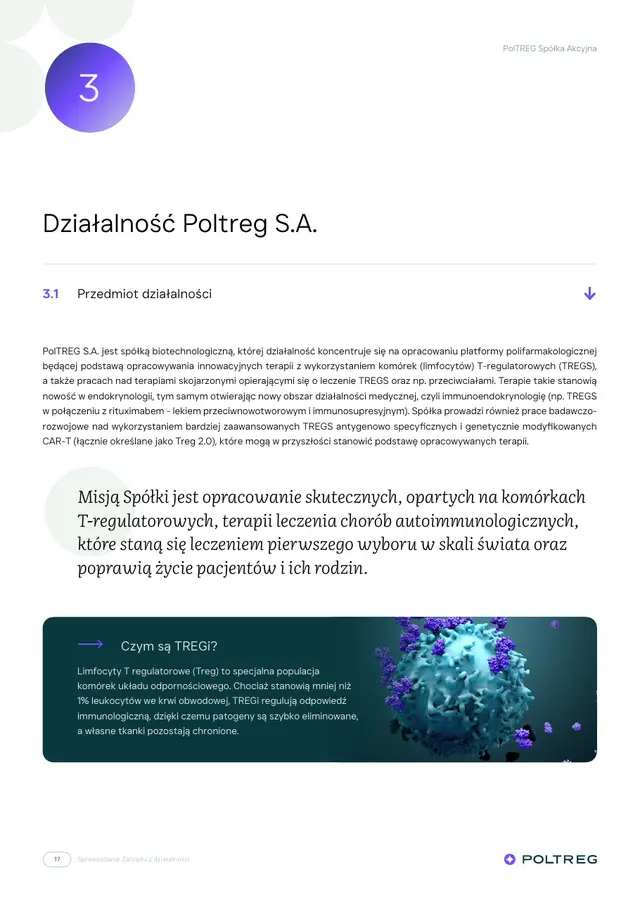
Circles from the brand symbol form the letter P. Some of them are windows with photos from the laboratory.
The sans serif speaks of science, the serif italic adds warmth. The same pair works on the website and in presentations.
The darkest colour in the brand palette belongs to covers and section openings. The light background is kept for content.
The publication date in a rounded frame: a small detail that returns on every cover.
Circles from the brand symbol return next to page titles, like the company's signature.
Each section sits in a rounded frame with its page number, so the contents read like a map.
Two columns let a long contents list fit on a single page.
Every section opens with a dark page and a large photo in the brand's purple tones.
The section title starts with a circle from the brand symbol, and the last word turns italic, as on the cover.
The page number and the logo in the footer sit in the same place on every page.
A purple circle with a number shows where in the report you are.
3.1, 3.2, 3.3: numbered subheadings with an arrow guide readers through a long section.
We pull the company's mission out of the text and set it in larger italics. Even someone just flicking through the pages will read it.
A dark box explains what regulatory T cells are. Investors don't need to be immunologists to understand what they're investing in.
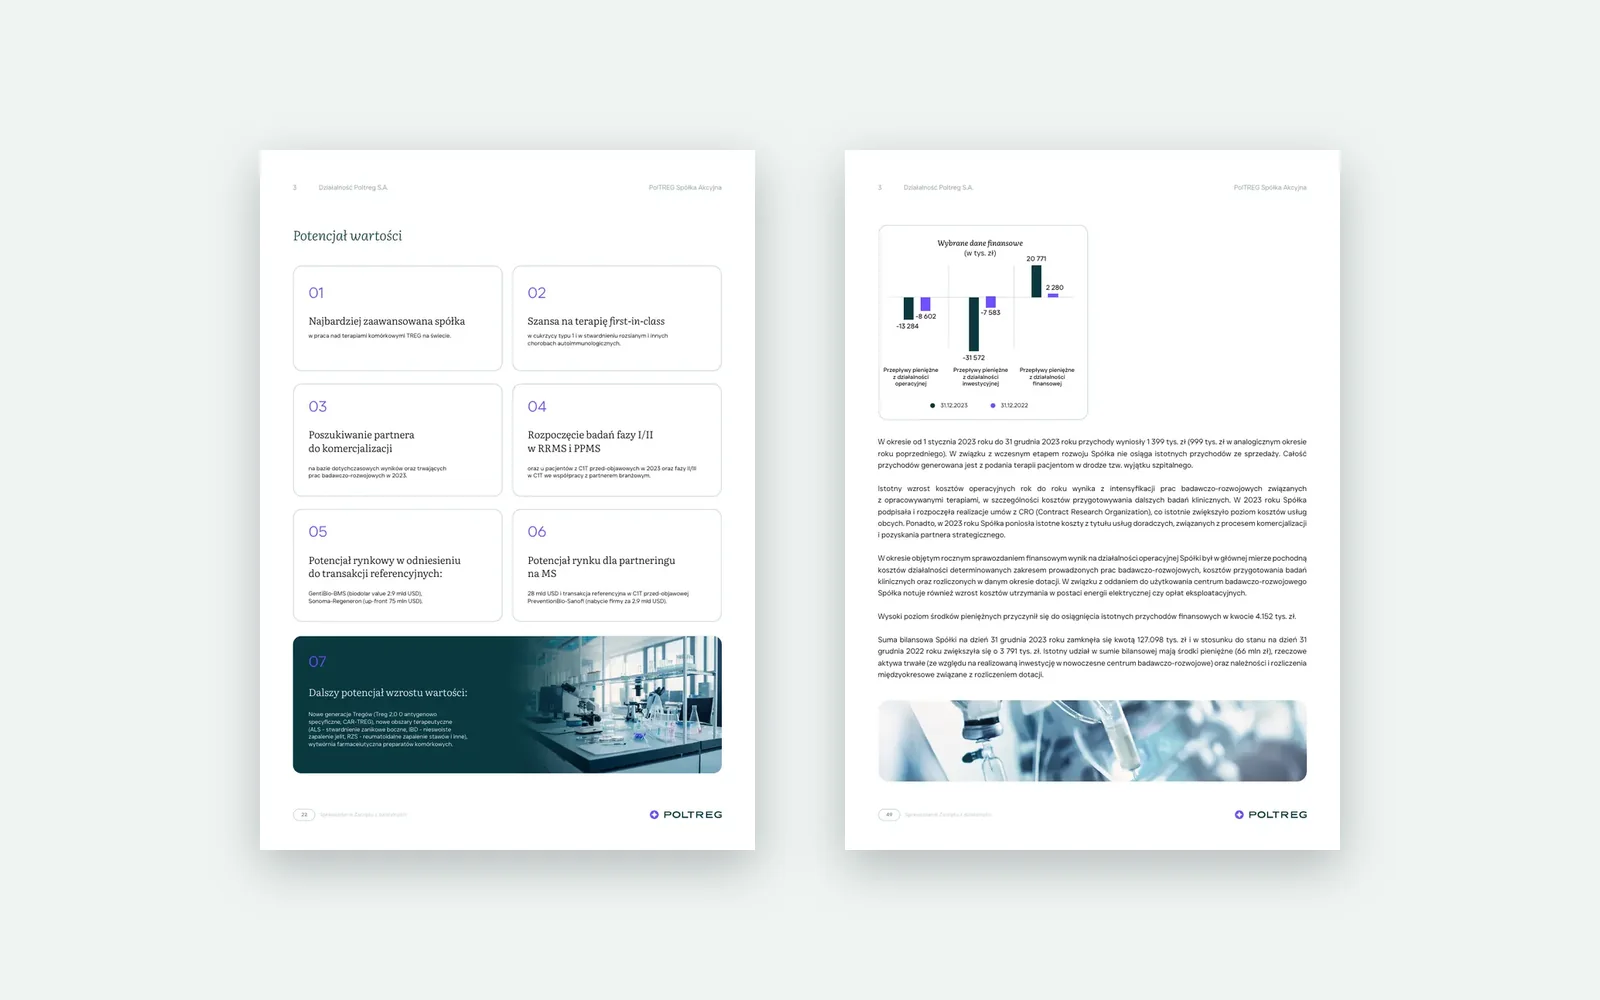
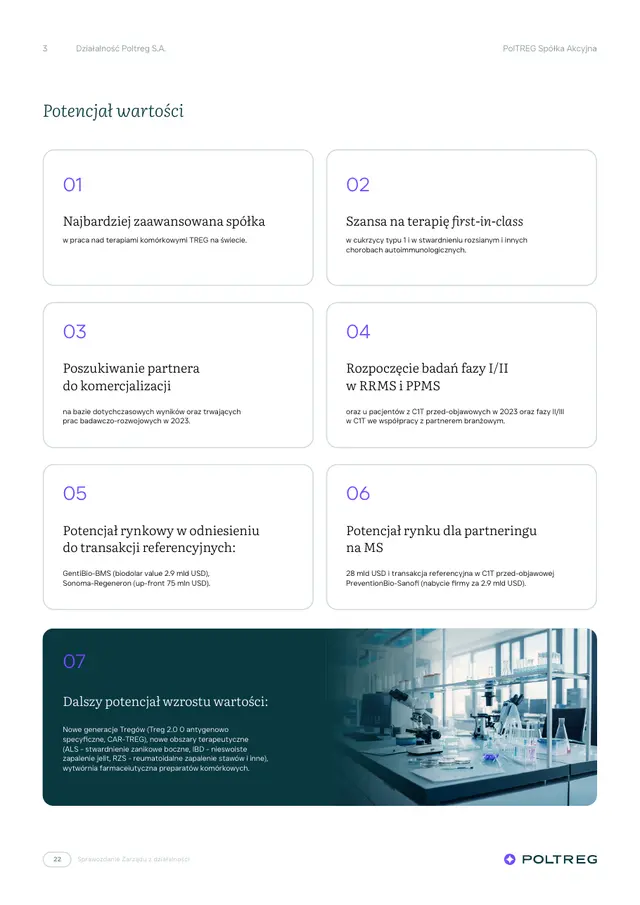
The company's potential set out in tiles: each argument has its own number, title and a two-sentence description.
Purple numbers lead the eye in order, from the first tile to the last.
The last tile sits on a dark background with a photo and closes the page like a punchline.
05Investors
Investors increasingly read reports on the company website and want to find the latest report, the publication calendar and the shareholder structure in a few clicks. We design and build sections like these, together with an admin panel where the company adds new reports itself.

PolTREG
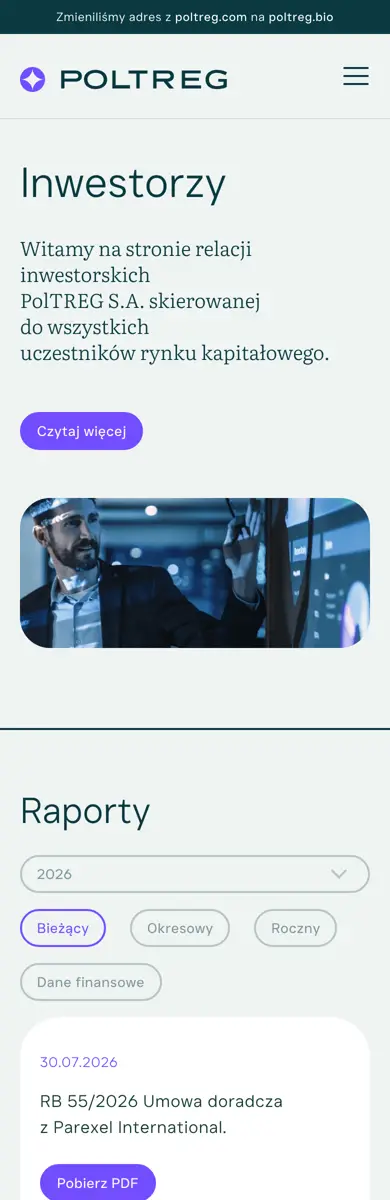
The investor section on poltreg.bio: reports with a filter and year selection, general meetings, company documents, shareholder structure in charts, presentations and a publication calendar, in Polish and English.
See the PolTREG projectGrupa BEST
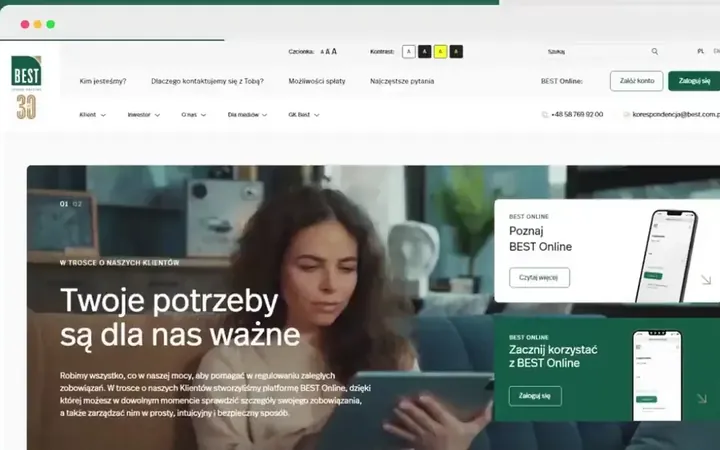
On the new best.com.pl, investor relations and reports sit next to the customer platform, in Polish and English. We moved over 4,000 posts, reports and documents onto it.
See the Grupa BEST project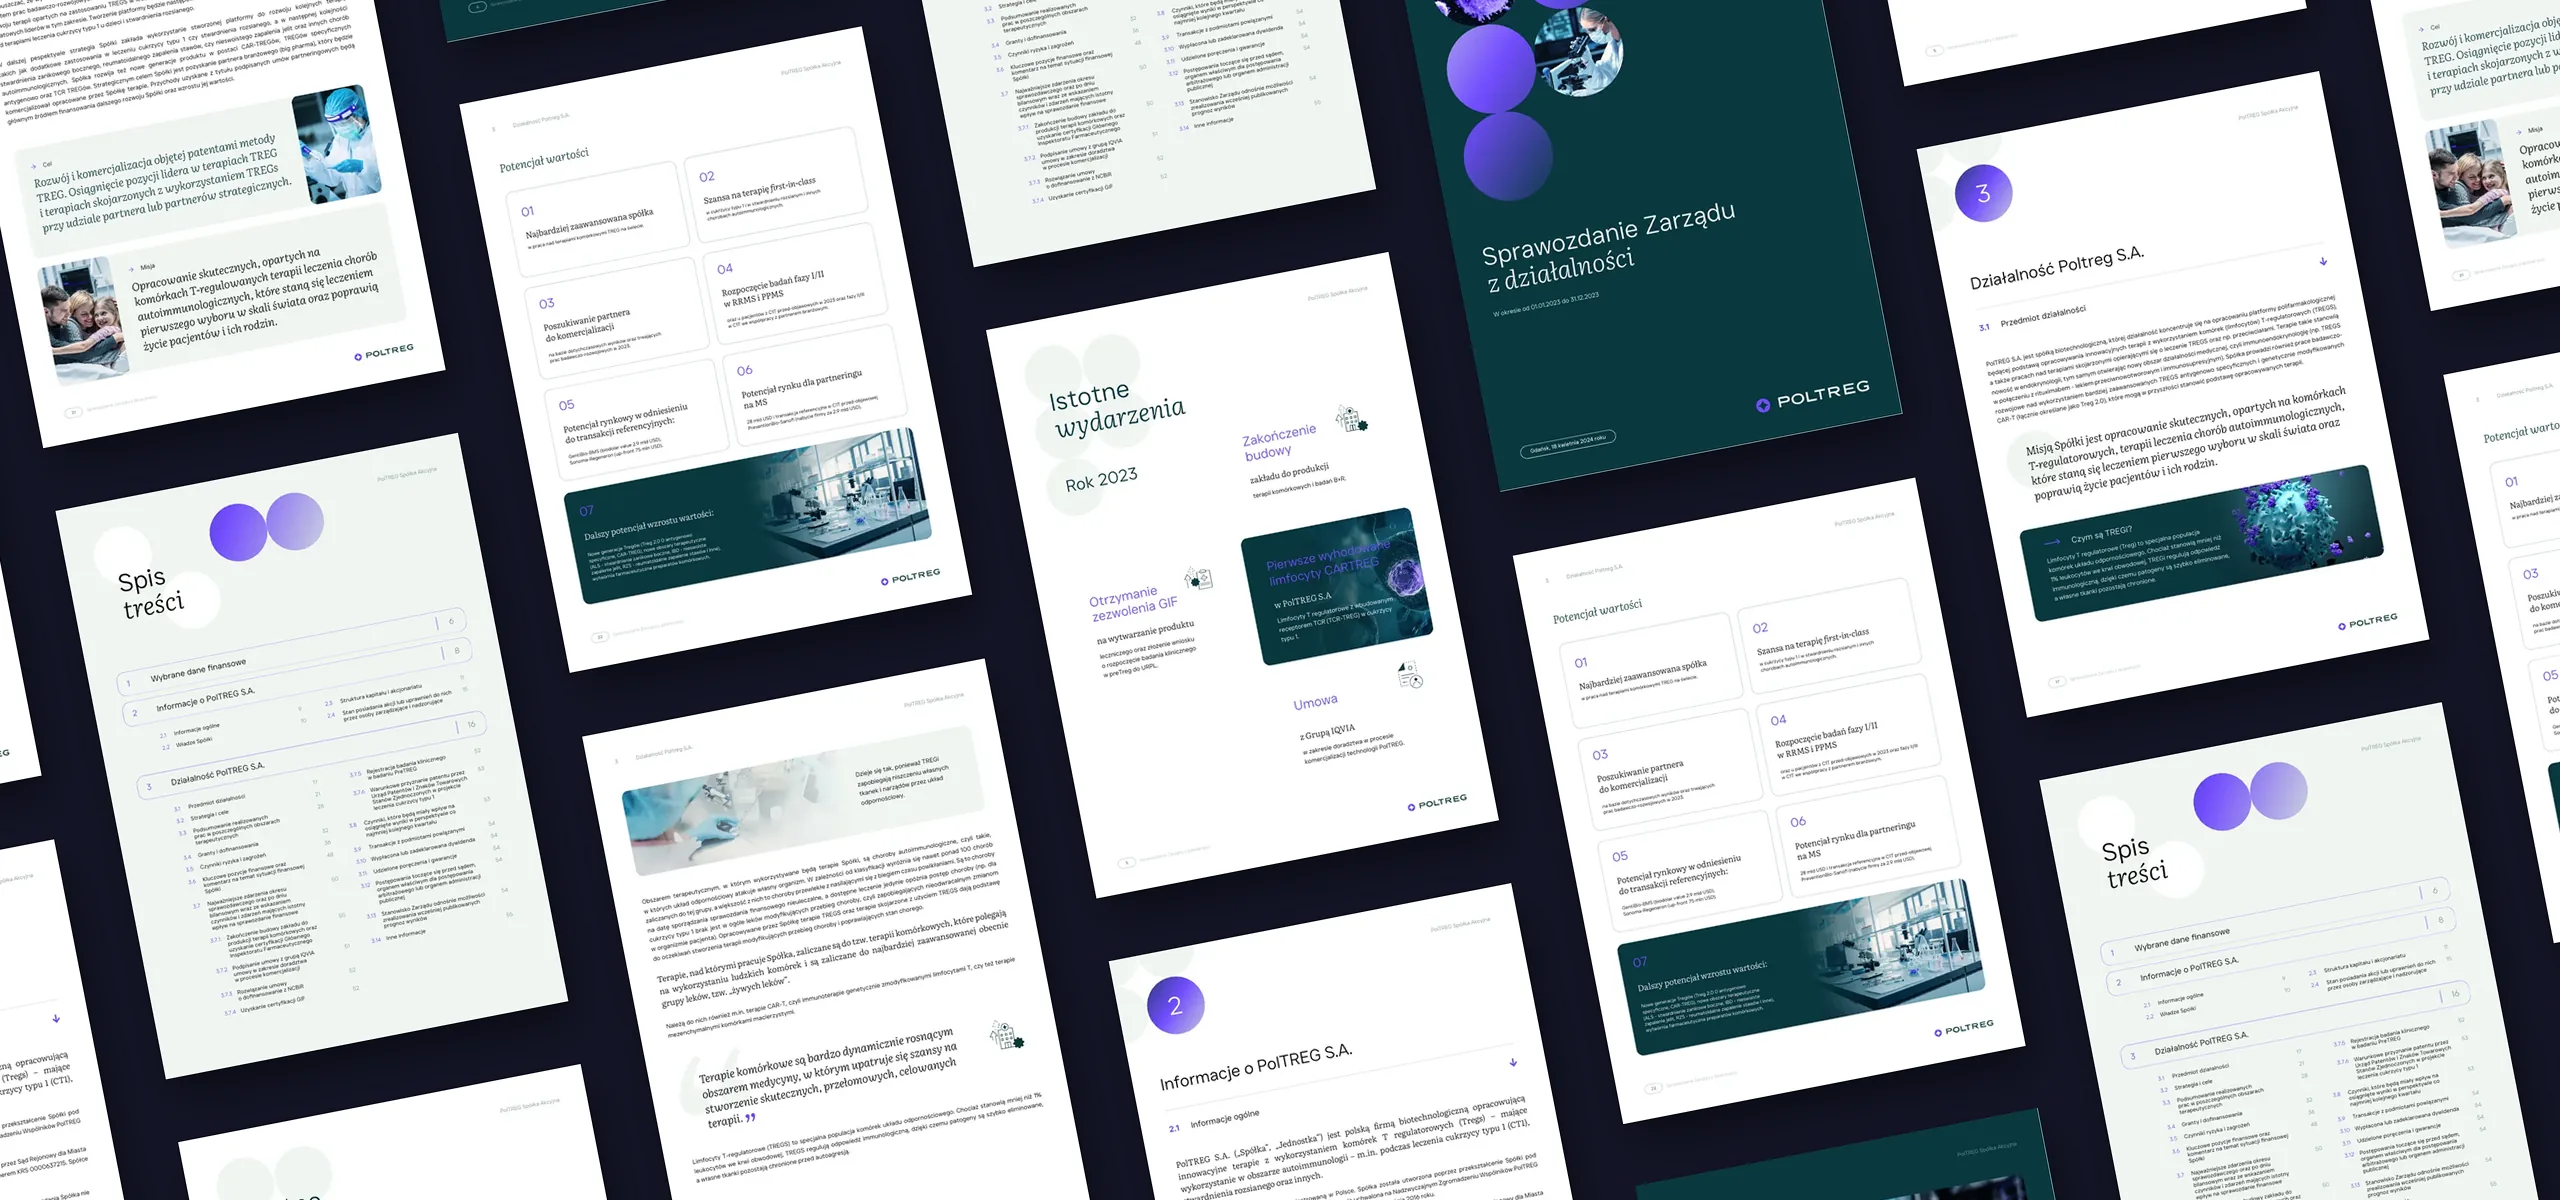
06Process
Six stages, each ending with something you can review and approve. Before we start, you know how the work will run, when you'll get what and what to expect at the end. For a quarterly report in an existing template the first two stages take no time at all; for a first annual report, each one is a project of its own.
What we do
We agree on what, by when and in how many languages.
We start with the publication calendar: when the report must be ready, who approves it and which languages it comes out in. We agree on the scope, the number of pages and what we need from the finance and investor relations teams.
What you get
What we do
We design the grid, cover, section openings and table styles.
Based on the company's identity, we design the template: grid, typefaces, colours, cover, section openings, and table and chart styles. We show it on a few real pages and check that its styles cover every table and chart before we typeset the whole report. When a template already exists, we go straight to typesetting.
What you get
What we do
We gather the text and spreadsheets and put them in order.
We receive the text in Word, and the tables and data in Excel. We arrange them into the report structure, pull out the key figures and sentences, and draw charts straight from the spreadsheets so the numbers match.
What you get
What we do
We typeset the text, tables, charts and photos.
We typeset the report page by page in the template: text with a clear hierarchy of subheadings, tables in one style, charts in the company's colours, and photos. The English version is set in the same layout, so the pages of both versions match.
What you get
What we do
We make corrections in rounds, up to board approval.
We collect corrections as comments in a PDF and make them in rounds, with a list of changes after each one. We make sure a figure corrected in a table also changes in the text and on the chart.
What you get
What we do
We prepare the files for publication, the website and print.
You get a PDF for publication, a lighter version for the website and, if needed, print-ready files. The template stays: for the next report we start straight with typesetting, so each new edition comes together faster.
What you get
07Questions
Yes, that's how most reports start. We typeset the text from Word, and the tables and charts from the spreadsheets. We only ask for versions that have already been through the finance team, to keep corrections to a minimum.
A new report in an existing template usually takes us a few days to typeset, depending on its length and the number of correction rounds. The first report with a new template takes longer, which is why we plan the schedule backwards from the publication date.
From day one you have a schedule: what will be ready at each stage, when, and what we need from you. After each stage we show the result and explain the decisions behind it, and we keep you updated on progress along the way, including while we're waiting for data from the finance team.
Yes. We prepare the template in the software your team works in, with text, table and chart styles and a short guide, so every new edition looks like the first.
The template is built on the company's identity: its typefaces, colours and mark. When there's no identity, or it has aged, we start with branding, as we did for PolTREG: first the new brand, then reports in its template.
Yes. The English version is set in the same layout as the Polish one, so the pages, tables and charts of both versions match. The translation comes from you or your translator.
Yes. An ESG report follows the same rules as an annual one: lots of data, several audiences and a deadline. We typeset it in the company template, so it sits next to the annual report like a sibling.
The company files the report in ESPI, the Polish system for regulatory announcements, and we prepare the files: a PDF for publication, a lighter version for the website and print files. We can also order the printing and oversee it for you.
We quote each report separately. The price depends on the number of pages, tables and charts, the language versions and whether a template already exists. For new editions in the same template the scope is known, so the price is predictable too.
"*" indicates required fields
Cookies
With your consent, we use Google Analytics and Hotjar to see how people use the site, and Google Ads to measure how well our ads work. Without consent, the site works just the same. You can change your choice at any time under “Cookie settings” in the footer. Details are in our privacy policy.
The fluo_zgoda cookie remembers this choice for 12 months. Cloudflare Turnstile protects the forms from bots.
Plausible counts visits without cookies or personal data, so it works regardless of this choice.